Introduction
Nagios is an open source software that can be used for network and infrastructure monitoring. Nagios will monitor servers, switches, applications and services. It alerts the System Administrator when something went wrong and also alerts back when the issues has been rectified.
Features
- Monitor your entire IT infrastructure;
- Identify problems before they occur;
- Know immediately when problems arise;
- Share availability data with stakeholders.hypothetical question;
- Detect security breaches;
- Plan and budget for IT upgrades;
- Reduce downtime and business losses.
Scenario
In this tutorial i am going to use two systems as mentioned below.
Nagios server:
Operating system : CentOS 7 minimal server
IP Address : 192.168.1.150/24
Nagios client:
Operating System : CentOS 7 minimal server
IP Address : 192.168.1.152/24
Prerequisites
Before installing Nagios, make sure that you’ve a properly installed and configured LAMP stack in your server. To install and configure LAMP server, refer the following link.
Also install the following prerequisites too. All commands should be run as root user.
yum install gd gd-devel gcc glibc glibc-common wget
Create Nagios User And Group
Create a new nagios user account and give it a password:
useradd -m nagios
passwd nagios
Create a new nagcmd group for allowing external commands to be submitted through the web interface. Add both the nagios user and the apache user to the group.
groupadd nagcmd
usermod -a -G nagcmd nagios
usermod -a -G nagcmd apache
Download Nagios And Plugins
Go to the nagios download page, and get the latest version. As of writing this, the latest version was 4.0.8.
wget http://prdownloads.sourceforge.net/sourceforge/nagios/nagios-4.0.8.tar.gz
And, download nagios plugins too.
wget http://nagios-plugins.org/download/nagios-plugins-2.0.3.tar.gz
Install Nagios And Plugins
Install nagios:
I tested this how-to on CentOS 7 minimal server, although it should work on all RHEL 7 and its clones like Scientific Linux 7 too.
Go to the folder where you’ve downloaded nagios, and extract it using command:
tar xzf nagios-4.0.8.tar.gz
Change to the nagios directory, and run the following commands one by one from the Terminal to compile and install nagios.
cd nagios-4.0.8
./configure --with-command-group=nagcmd
make all
make install
make install-init
make install-config
make install-commandmode
Install Nagios Web interface:
Enter the following commands to compile and install nagios web interface.
make install-webconf
Create a nagiosadmin account for logging into the Nagios web interface. Remember the password you assign to this account. You’ll need it while logging in to nagios web interface..
htpasswd -c /usr/local/nagios/etc/htpasswd.users nagiosadmin
Restart Apache to make the new settings take effect.
systemctl restart httpd
Install Nagios plugins:
Go to the directory where you downloaded the nagios plugins, and extract it.
tar xzf nagios-plugins-2.0.3.tar.gz
Change to the nagios plugins directory:
cd nagios-plugins-2.0.3
Run the following commands one by one to compile and install it.
./configure --with-nagios-user=nagios --with-nagios-group=nagios
make
make install
We aren’t finished yet.
Configure Nagios
Nagios sample configuration files have now been installed in the /usr/local/nagios/etc directory. These sample files should work fine for getting started with Nagios. However, you’ll need to put your actual email ID to receive alerts.
To do that, Edit the /usr/local/nagios/etc/objects/contacts.cfg config file with your favorite editor and change the email address associated with the nagiosadmin contact definition to the address you’d like to use for receiving alerts.
vi /usr/local/nagios/etc/objects/contacts.cfg
Find the following line and enter the email id:
[...]
define contact{
        contact_name                    nagiosadmin             ; Short name of user
        use                             generic-contact         ; Inherit default values from generic-contact template (defined above)
        alias                           Nagios Admin            ; Full name of user

        email                           sk@unixmen.com  ; <<***** CHANGE THIS TO YOUR EMAIL ADDRESS ******
        }
[...]
Save and close the file.
Then, Edit file /etc/httpd/conf.d/nagios.conf,
vi /etc/httpd/conf.d/nagios.conf
And edit the following lines if you want to access nagios administrative console from a particular IP series. Here, I want to allow nagios administrative access from 192.168.1.0/24 series only.
[...]
## Comment the following lines ##
#   Order allow,deny
#   Allow from all

## Uncomment and Change lines as shown below ##
Order deny,allow
Deny from all
Allow from 127.0.0.1 192.168.1.0/24
[...]
Restart httpd service:
systemctl restart httpd
Now, check for any configuration errors using command:
/usr/local/nagios/bin/nagios -v /usr/local/nagios/etc/nagios.cfg
If there are no errors, start nagios service and make it to start automatically on every boot.
systemctl start nagios
chkconfig --add nagios
chkconfig nagios on
Adjust SELinux Settings
By default, SELinux will be in enforcing mode, and it throws “Internal Server Error” messages when you attempt to access the Nagios CGIs.
To rectify this error, edit file /etc/selinux/config:
vi /etc/selinux/config
And, set SELinux to permissive mode.
[...
SELINUX=permissive
[...]
Reboot your server to take effects the changes.
Access Nagios Web Interface
Open nagios administrator console with URL http://nagios-server-ip/nagios and enter the username as nagiosadmin and its password which we created in the earlier steps.
![Mozilla Firefox_001]()
This is how Nagios administrative console looks:
![Nagios Core - Mozilla Firefox_002]()
Click on the “Hosts” section in the left pane of the console. You will see there the no of hosts to be monitored by Nagios server. We haven’t added any hosts yet. So it simply monitors the localhost itself only.
![Nagios Core - Mozilla Firefox_003]()
Click on the particular host to display more details:
![Nagios Core - Mozilla Firefox_005]()
Add Monitoring targets to Nagios server
Now, let us add some clients to monitor by Nagios server. To do that we have to install nrpe and nagios-plugins in our monitoring targets.
On CentOS/RHEL/Scientifc Linux clients:
Add EPEL repository in your CentOS/RHEL/Scientific Linux 6.x or 7 clients to install nrpe package.
To install EPEL on CentOS 7, run the following command:
yum install epel-release
On CentOS 6.x systems, refer the following link.
Install “nrpe” and “nagios-plugins” packages in client systems:
yum install nrpe nagios-plugins-all openssl
On Debian/Ubuntu clients:
sudo apt-get install nagios-nrpe-server nagios-plugins
Configure Monitoring targets
Edit /etc/nagios/nrpe.cfg file,
sudo vi /etc/nagios/nrpe.cfg
Add your Nagios server ip address:
[...]
## Find the following line and add the Nagios server IP ##
allowed_hosts=127.0.0.1 192.168.1.150
[...]
Start nrpe service on CentOS clients:
CentOS 7:
systemctl start nrpe
chkconfig nrpe on
CentOS 6.x:
service nrpe start
chkconfig nrpe on
For Debian/Ubuntu Clients, start nrpe service as shown below:
sudo /etc/init.d/nagios-nrpe-server restart
Now, go back to your Nagios server, and add the clients in the configuration file.
To do that, Edit “/usr/local/nagios/etc/nagios.cfg” file,
vi /usr/local/nagios/etc/nagios.cfg
and uncomment the following lines.
## Find and uncomment the following line ##
cfg_dir=/usr/local/nagios/etc/servers
Create a directory called “servers” under “/usr/local/nagios/etc/”.
mkdir /usr/local/nagios/etc/servers
Create config file to the client to be monitored:
vi /usr/local/nagios/etc/servers/clients.cfg
Add the following lines:
define host{

use                             linux-server

host_name                       client

alias                           client

address                         192.168.1.152

max_check_attempts              5

check_period                    24x7

notification_interval           30

notification_period             24x7

}
Here, 192.168.1.152 is my nagios client IP address. Finally restart nagios service.
systemctl restart nagios
Wait for few seconds, and refresh nagios admin console in the browser and navigate to “Hosts” section in the left pane. You will see the newly added client will be visible there. Click on the host to see if there is anything wrong or any alerts it has.
![Nagios Core - Mozilla Firefox_006]()
Click on the monitoring target (client) to view the detailed output:
![Nagios Core - Mozilla Firefox_007]()
Similarly, you can define more clients by creating a separate config files “/usr/local/nagios/etc/servers” directory for each client.
Define services
We have just defined the monitoring host. Now, let us add some services of the monitoring host. For example, to monitor the ssh service, add the following lines shown in bold in the “/usr/local/nagios/etc/servers/clients.cfg” file.
vi /usr/local/nagios/etc/servers/clients.cfg
Add the following lines shown in bold:
define host{

use                             linux-server

host_name                       client

alias                           client

address                         192.168.1.152

max_check_attempts              5

check_period                    24x7

notification_interval           30

notification_period             24x7

}

define service {
        use                             generic-service
        host_name                       client
        service_description             SSH
        check_command                   check_ssh
        notifications_enabled           0
        }
Save and close the file. Restart Nagios.
systemctl restart nagios
Wait for few seconds, and check for the added services (i.e ssh) in the nagios web interface. Navigate to Services section on the left side bar, you’ll see the ssh service there.
![Nagios Core - Mozilla Firefox_008]()
To know more about object definitions such as Host definitions, service definitions, contact definitions, please do visit here. This page will explain you the description and format of all object definitions.
Thats it. Cheers!
Source
---------------------------------------------------------------------
Install And Configure Nagios 4 On CentOS 7


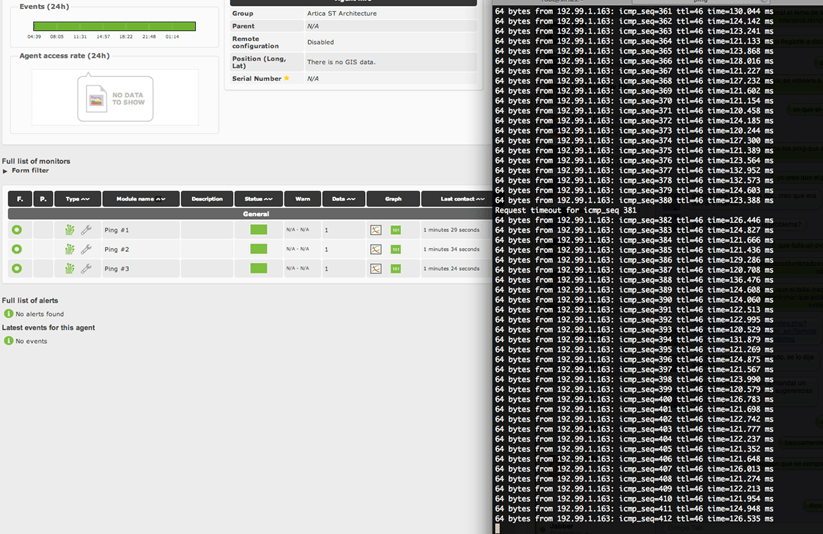
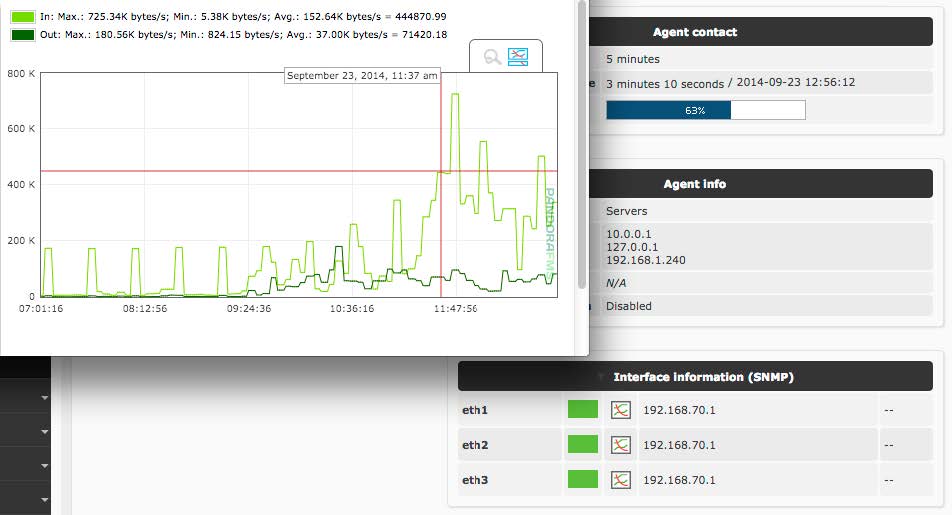
 way the status and performance of several parameters from different operating systems, servers, applications and hardware systems such as firewalls, proxies, databases, web servers or routers.


![Pandora 5 [Running] - Oracle VM VirtualBox_001](http://180016988.r.cdn77.net/wp-content/uploads/2013/12/Pandora-5-Running-Oracle-VM-VirtualBox_001.jpg)


![Zabbix Server: Latest data [refreshed every 30 sec] - Mozilla Firefox_018](http://180016988.r.cdn77.net/wp-content/uploads/2014/01/Zabbix-Server-Latest-data-refreshed-every-30-sec-Mozilla-Firefox_018-1024x620.jpg)
![Zabbix Server: Latest data [refreshed every 30 sec] - Mozilla Firefox_020](http://180016988.r.cdn77.net/wp-content/uploads/2014/01/Zabbix-Server-Latest-data-refreshed-every-30-sec-Mozilla-Firefox_020-1024x620.jpg)
![Zabbix Server: History [refreshed every 30 sec] - Mozilla Firefox_021](http://180016988.r.cdn77.net/wp-content/uploads/2014/01/Zabbix-Server-History-refreshed-every-30-sec-Mozilla-Firefox_021-1024x620.jpg)


![Zabbix Server: Latest data [refreshed every 30 sec] - Mozilla Firefox_028](http://180016988.r.cdn77.net/wp-content/uploads/2014/01/Zabbix-Server-Latest-data-refreshed-every-30-sec-Mozilla-Firefox_028-1024x620.jpg)
![Zabbix Server: Latest data [refreshed every 30 sec] - Mozilla Firefox_029](http://180016988.r.cdn77.net/wp-content/uploads/2014/01/Zabbix-Server-Latest-data-refreshed-every-30-sec-Mozilla-Firefox_029-1024x620.jpg)
![Zabbix Server: History [refreshed every 30 sec] - Mozilla Firefox_030](http://180016988.r.cdn77.net/wp-content/uploads/2014/01/Zabbix-Server-History-refreshed-every-30-sec-Mozilla-Firefox_030-1024x620.jpg)