Quantcast
Channel: monitoring tools Archives | Unixmen
Viewing all 33 articles
Browse latest View live

Install Shinken Monitoring Framework On Ubuntu

$
0
0

About Shinken Monitoring Framework

Shinken is an open source monitoring framework based on Nagios core. It is written using Python and is licensed under the terms of the GNU Affero General Public License. Hence, It is based on Nagios core you can use the nagios configuration and plugins without modifying or re-writing them. Shinken has no limits regarding distribution. You can scale it to your LAN, through your DMZs and even across several datacenters. Shinken is very easy compared to Nagios in terms of usage and installation. It is multi-platform, and you can easily migrate from nagios.

Features

The following are the features of Shinken.

  • Ready to run monitoring packs;
  • Endless scalability and RAID-like availability;
  • Focus on critical business impacts only;
  • Full virtualization integration;
  • Keep your Nagios configuration and plugins;
  • Load balancing;
  • High availability;
  • Multi-paltform;
  • Multi sites management;
  • and many.

In this guide, we will see how to install and configure Shinken on Ubuntu 14.04 system. Although, the same steps should work on Debian too.

Installation

Change to root user with command:

sudo su

Install the following required dependencies.

apt-get update
apt-get install python-pip python-pycurl python-cherrypy3 python-setuptools -y

Create a new user namely shinken.

adduser shinken

Now, run the following command to download and install Shinken.

pip install shinken

Sample output:

Downloading/unpacking shinken
  Downloading Shinken-2.2.tar.gz (27.1MB): 27.1MB downloaded
  Running setup.py (path:/tmp/pip_build_root/shinken/setup.py) egg_info for package shinken

[...]

Changing owner of /etc/shinken to shinken:shinken
    Changing owner of /var/run/shinken to shinken:shinken
    Changing owner of /var/log/shinken to shinken:shinken
    Changing owner of /var/lib/shinken/ to shinken:shinken
    Changing owner of /var/lib/shinken/libexec to shinken:shinken
    Changing owner of /usr/bin/shinken to shinken:shinken
    Changing owner of /usr/bin/shinken-receiver to shinken:shinken
    Changing owner of /usr/bin/shinken-scheduler to shinken:shinken
    Changing owner of /usr/bin/shinken-broker to shinken:shinken
    Changing owner of /usr/bin/shinken-poller to shinken:shinken
    Changing owner of /usr/bin/shinken-arbiter to shinken:shinken
    Changing owner of /usr/bin/shinken-reactionner to shinken:shinken
    Changing owner of /usr/bin/shinken-discovery to shinken:shinken
    Shinken setup done
Successfully installed shinken
Cleaning up...

Shinken has been installed now.

Change to the ‘shinken’ user and initialize shinken.

su shinken
shinken --init

Sample output:

Creating ini section paths
Creating ini section shinken.io
Saving the new configuration file /home/shinken/.shinken.ini

Now, install Shinken web user interface using command:

shinken install webui

Sample output:

Grabbing : webui
OK webui

Install Shinken identification module too.

shinken install auth-cfg-password

Sample output:

Grabbing : auth-cfg-password
OK auth-cfg-password

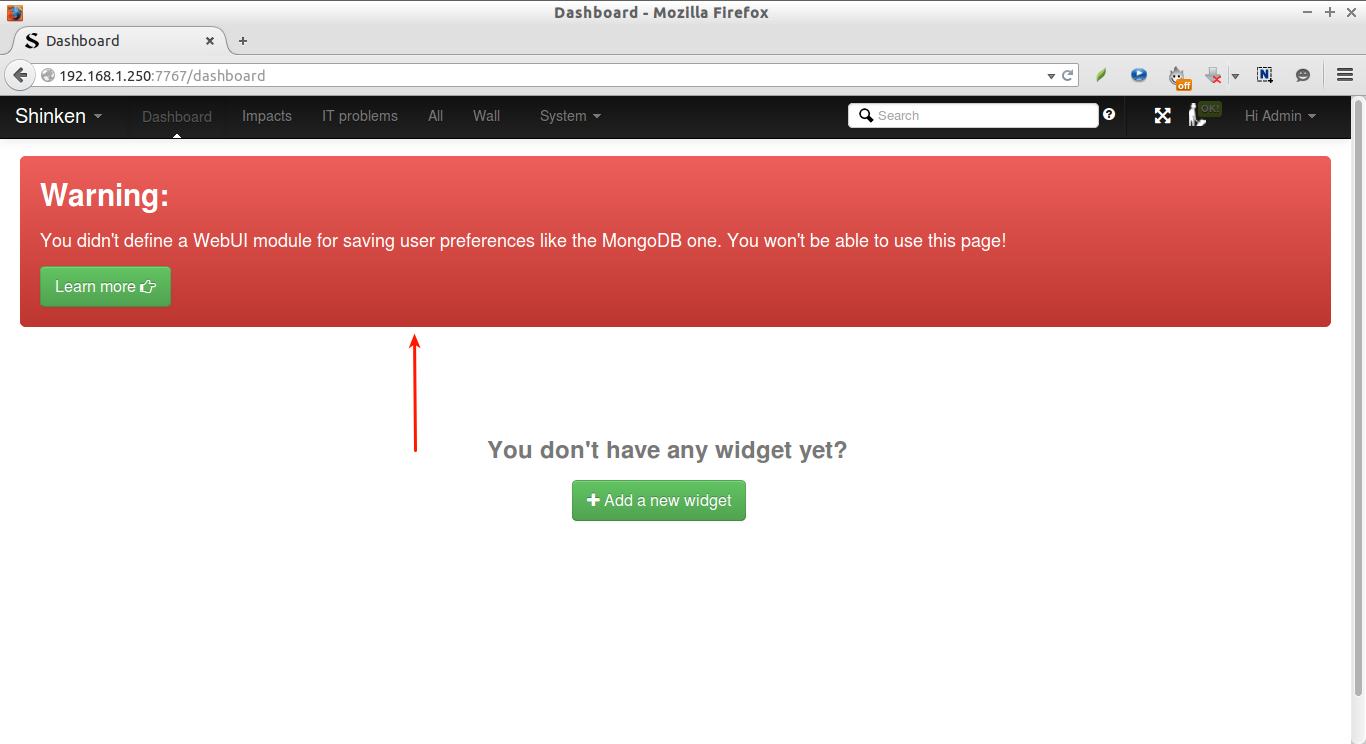
Here is an important part. We need to install a module to store user data in a database. If you didn’t install this module, you will have the following error while accessing Shinken Dashboard:

Warning:

You didn’t define a WebUI module for saving user preferences like the MongoDB one. You won’t be able to use this page!

Dashboard - Mozilla Firefox_004

Here, we will install sqlitedb module using command:

shinken install sqlitedb

Sample output:

Grabbing : sqlitedb
OK sqlitedb

We have finished the installation of Shinken and it’s modules now. You can find the installation and configuration files in the following locations.

  • /etc/shinken for configuration files
  • /var/lib/shinken for shinken modules, retention files…
  • /var/log/shinken for log files
  • /var/run/shinken for pid files

Next, we will see Shinken configuration.

Shinken Configuration

First we need to enable Webui by editing the broker-master.cfg file,

nano /etc/shinken/brokers/broker-master.cfg

Add the following line:

[...]
modules     webui
[...]

Edit webui.cfg file to enable authentication modules and SQLite database for the user interface.

nano /etc/shinken/modules/webui.cfg

Add the following line:

[...]
modules         auth-cfg-password,SQLitedb
[...]

Save and close the file.

Restart shinken service.

service shinken restart

Now, you’ll be able to access the Shinken webui using URL: http://ip-address:7767. The default username/password is admin/admin.

However, It is recommended to change the admin user password to something strong.

Edit the following file and change the default admin user password.

nano /etc/shinken/contacts/admin.cfg
# This is a default admin
# CHANGE ITS PASSWORD!

define contact{
    use             generic-contact
    contact_name    admin
    email           sk@unixmen.com   
    pager           0600000000   ; contact phone number
    password        <put-strong-password>
    is_admin        1
    expert          1
}

Save and close the file.

Now, restart shinken service.

service shinken restart

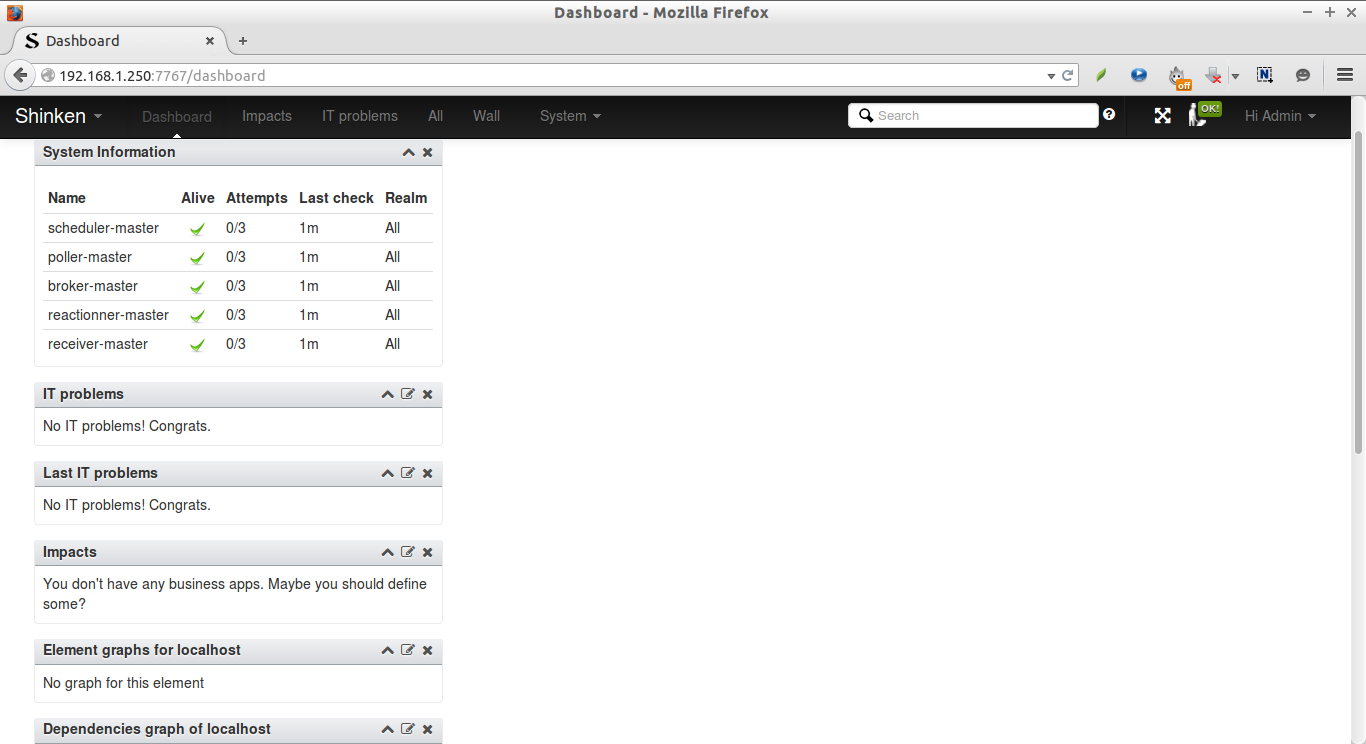
Now, open up your web browser and access the Shinken web console using URL: http://ip-address:7767.

Enter the username and password which we defined in the above steps.

Shinken UI login - Mozilla Firefox_001

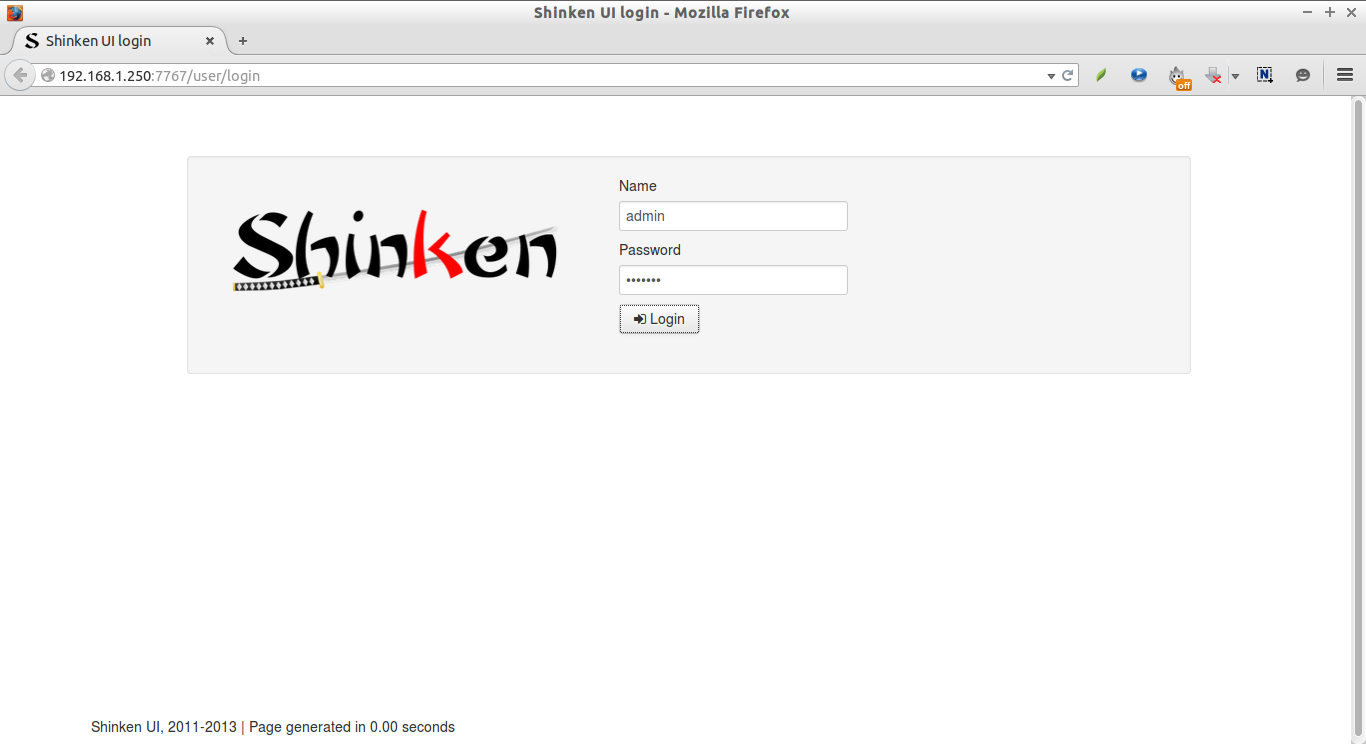
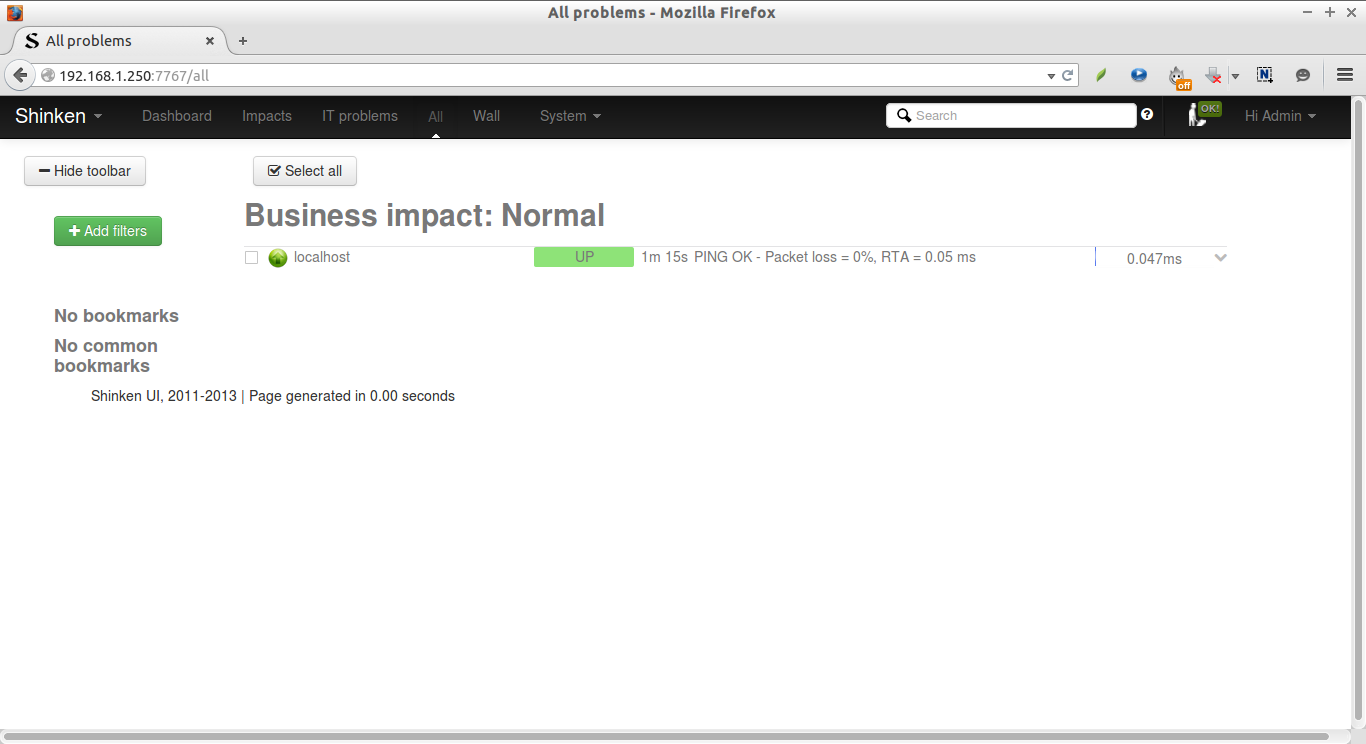
This is how your Shinken web console will look.

All problems - Mozilla Firefox_001

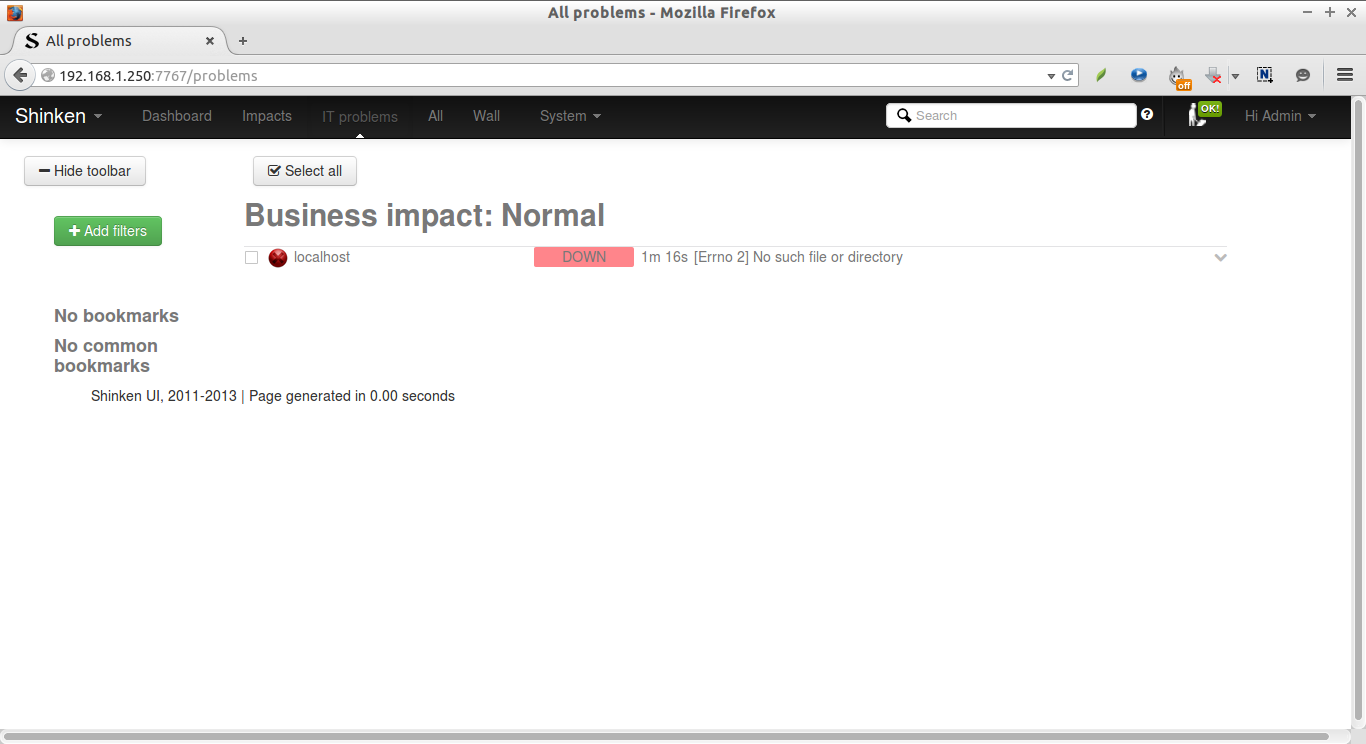
As you see above, the Shinken server(localhost) is being monitored by default. And the localhost is down with error:

[Errno 2] No such file or directory.

This is because we haven’t installed the monitoring plugins yet.

We will download and install some plugins. Return back to the root user by typing: exit.

Then, enter the following command to download shinken plugins.

 wget --no-check-certificate https://www.monitoring-plugins.org/download/monitoring-plugins-2.1.1.tar.gz

You can find the latest plugins here.

Extract the tar file.

tar -xvf monitoring-plugins-2.1.1.tar.gz

Now, install the plugins using commands:

cd monitoring-plugins-2.1.1
./configure --with-nagios-user=shinken --with-nagios-group=shinken --enable-libtap --enable-extra-opts --enable-perl-modules --libexecdir=/usr/lib/nagios/plugins
make install

That’s it.

Restart shinken service.

service shinken restart

Now, wait for few seconds and refresh or re-login to the shinken webui page.

Congratulations. Now, the Shinken server(localhost) is up and is being monitored by Shinken.

All problems - Mozilla Firefox_002

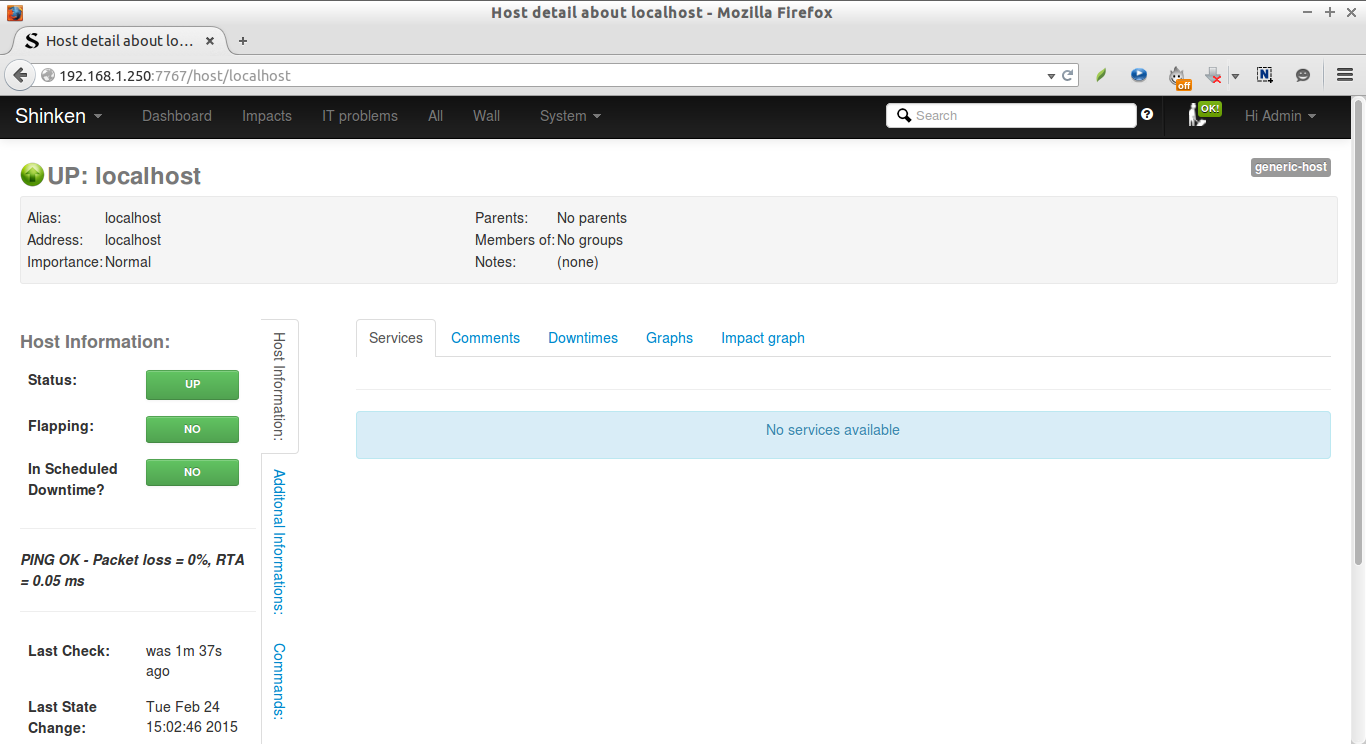
You can see detailed output by clicking on the localhost (or hostname of the server).

Host detail about localhost - Mozilla Firefox_003

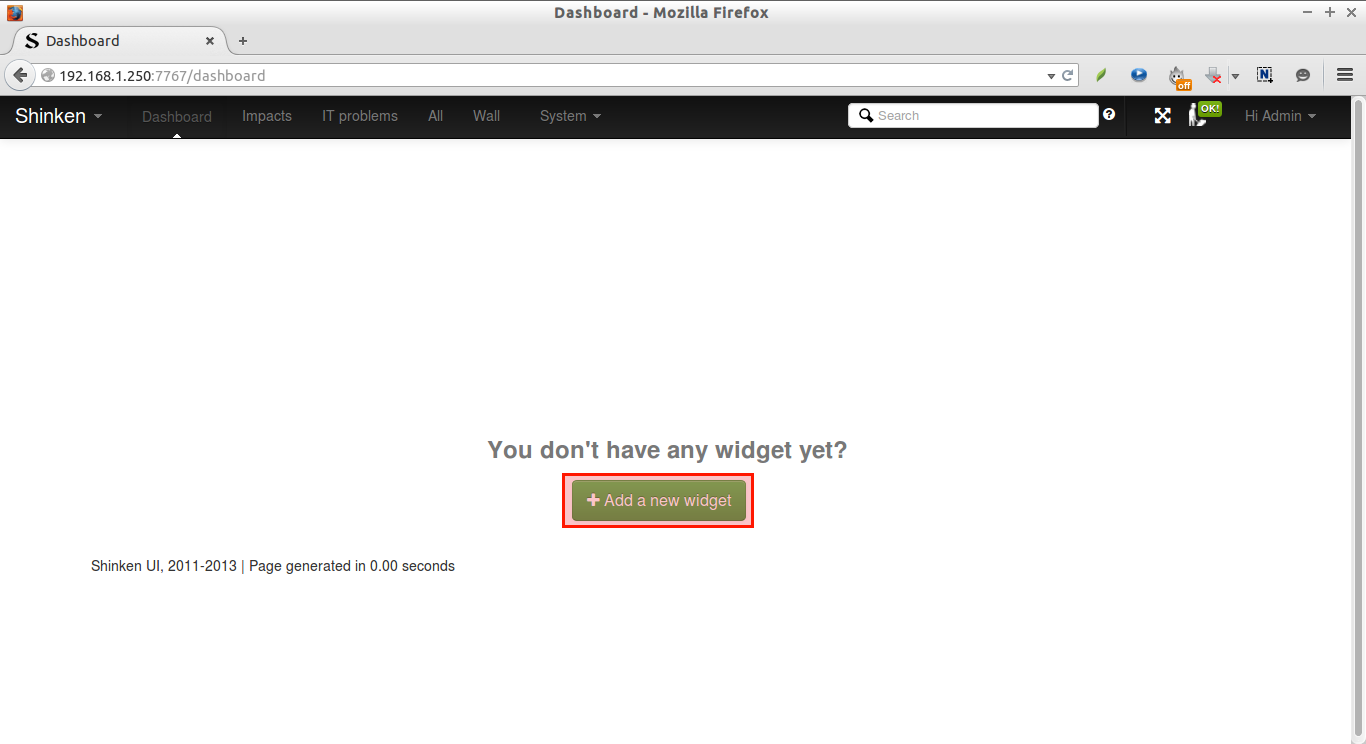
Initially, Shinken doesn’t has any widget by default. Let us add some widget. To do that, go to that Dashboard and click Add a new widget button.

Dashboard - Mozilla Firefox_004
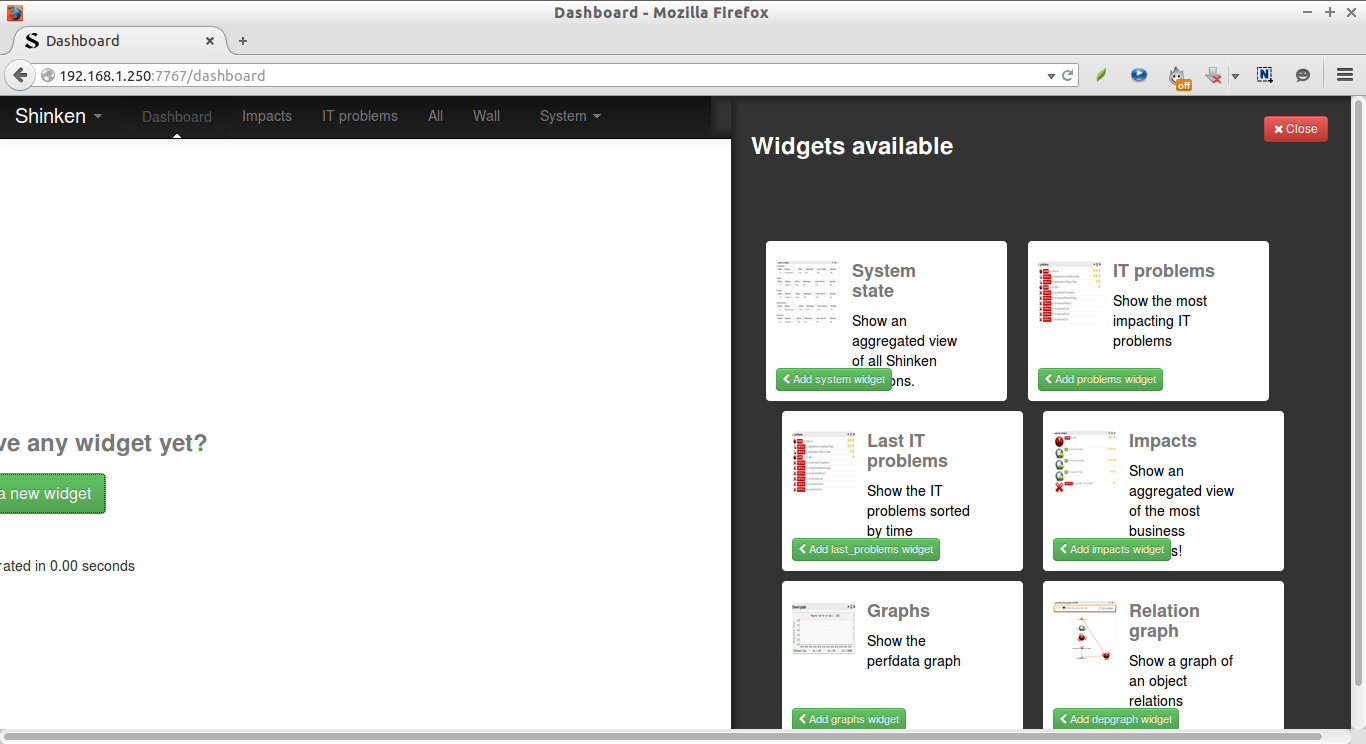
Select the available widgets on the right side.

Dashboard - Mozilla Firefox_005

Now, you’ll see the widgets have been added in the dashboard.

Dashboard - Mozilla Firefox_006

That’s all for now. We will see how to add clients and monitor them from the Shinken server in our upcoming article.

That’s it. Cheers!

Reference:


Advertise here with BSA

---------------------------------------------------------------------
Install Shinken Monitoring Framework On Ubuntu


List of Free And Open Source Monitoring System

$
0
0

The Linux monitoring systems are often used to follow system resources, such as CPU load, the amount of free RAM, network traffic statics or memory consumption. Which are ones from the most important tasks for every administrators. Furthermore, those tools notify the network administrator (via email, SMS or other alarms) when something interrupts or goes down which makes their life easier.

From those monitoring tools we will list the 7 most important in this article which will be described and identified by giving their features and mentioning their current version.

Nagios:

One from the most known, open source, powerful monitoring systems nowadays is Nagios. It enables organizations to identify and resolve IT infrastructure problems before affecting critical business processes.

nagos

Nagios is licensed under GNU General Public License which gives you permission to copy, broadcast and/or change it under certain conditions obviously. For more details, you can check the license as either as by using the LICENSE file of the Nagios distribution or by reading the online version of license.

Concerning its features we can list the following:

  • Monitor network services (SMTP, POP3, HTTP, NNTP, and PING), applications, operating systems, network protocols and system metrics with the same tool.
  • Detect infrastructure outages rapidly and send e-mail, SMS or call phone notifications to the right people when a problem is detected.
  • Define network host hierarchy
  • Users can easily develop their own services due to the simple plugin design of Nagios.
  • Ability to check the current network status, notifications and problem history
  • Open source software, full access to source code, licensed under GPL.

Seriously, Nagios is one awesome IT infrastructure monitoring tool which I strongly recommend it for every administrator wishes to make his work easier and organized but it is good also to use it with other monitoring tools since Nagios doesn’t show any graphs such as the network interface.

Cacti:

Cacti is another monitoring system licensed also under GPL but unlike Nagios, Cacti is a network graphing solution designed to exploit the power of RRDTool in storing data and building graphs.

cacti

It enables users to view CPU load graphs, RAM usage and other information collected from different hosts. Like Nagios, Cacti supports SNMP that makes it possible to monitor: Linux’s, BSD’s and windows hosts.

We can list the following features of Cacti:

  • Unlimited number of graph items.
  • Graph data can be manipulated using the CDEF math functions built in RRDTools.
  • Support all RRDTool’s graph items including AREA, STACK, LINE, COMMENT, VRULE, and HRULE.
  • Data sources can be created by utilizing RDDTool’s functions.
  • Permissions can be specified per-graph for each user.

But unlike Nagios, Cacti doesn’t notify users while problems appear so it is recommended to use other flexible tools supporting alerts.

 Centreon:

Centreon is our third type of free monitoring systems. Mostly called CES referencing to the Centreon Enterprise Server, is the choice of some world’s largest company. It lets company supervise all their infrastructure and applications comprising their information system.

Sans titre

Centreon has many advantages, we can list the following:

  • Enable to monitor the user’s servers, active elements and applications.
  • Real-time operating and component management console.
  • Ability to maintain and support the whole platform using the publisher solution.
  • Unlimited number of uses and extensions via open software mechanisms.

Currently there are 4 different solutions available to suit different organizations with evolving business needs.

  • The CES Standard is the only open and unlimited trial version. Unless it has a free access, a powerful industry-standard monitoring solution is offered.
  • CES Essentials is CES Standards including access to new software products and services such as Platinum level supports and various software extensions which allow users to automate the daily tasks of administration and monitoring.
  • CES Advanced is CES Essentials adding also the Centreon’s complementary plugin pack and different templates comprising databases, applications and infrastructure services.
  • The last one is CES Complete which is the mix of all the centreon software products and modules, including BI, BAM and Map. It is also delivered with Platinum level support.

Zabbix :

Zabbix is our fourth free monitoring system which is licensed as Nagios and Cacti under GPL and it is written in PHP. We can say that Zabbix is the mix of Nagios and Cacti functions: it is characterized by its simple way of monitoring data with graphs and its alerts sending to user in case of any problem.

Sans titre

Personally, I like the way how Zabbix can check and make report about every authorized or not change happen at one of the user’s servers.  This free monitoring tool, can from remote hosts where Zabbix is used. It offers different types of graphs such as network statistics, CPU load and others.

It is a little bit complicate for beginners and some additional time to be familiar with this monitoring system is recommended.

Zabbix as I mentioned offers the functions of Nagios and Cacti at same time, we can list the following features of this tool:

  • It is fully open source, free for commercial and non-commercial use.
  • It enables users to easily monitor their servers, network devices and applications, collecting appropriate statistics and performance data.
  • It is designed to scale from small environments with a few devices to large ones with thousands of monitored devices.
  • Like Nagios, it can send notification messages via e-mail, SMS for each notable event.

OpenNMS:

OpenNMS is another free network monitoring system and it is the world’s first enterprise grade monitoring tool which can be used a big number of unlimited devices. It enables users to discover and monitor services or nodes automatically in their network.

nms

OpenNMS has many advantages make it a very beneficial free network monitoring tool when we can list the following:

  • Automatic Service Discovery and Provisioning
  • Performance Data Collection Protocols (such as HTTP, JDBC, JMX, SNMP, XML etc)
  • Multi-Resource Performance Reports
  • Best Practical Solutions RT (Request Tracker)
  • Import of nodes, interfaces, and services from external provisioning system
  • Performance Data Export via simple XML Schema
  • Possibility to send e-mail or SMS notifications to the administrators

Icinga:

Icinga is another enterprise grade free monitoring system which enables users to follow network and its resources and also notifies them when any problem appear. This tool can monitor as either as complex or large environments across various locations.

mrtg

Some of its various features include:

  • Its capability to monitor different network services (SMTP, POP3, HTTP, NNTP, PING…)
  • Also monitor host resources (CPU load, disk usage…)
  • It allows users to easily develop their own services checks due to its simple plugin design.
  • It has support for monitoring redundant monitoring hosts.
  • It notifies users when service or host problems occur and when they also get resolved.

MRTG:

MRTG (Multi Router Traffic Grapher) is our last type of free monitoring system. It is simpler than Nagios, Cacti and Zabbix which can be more beneficial to use it with small projects. Mostly, it is used for monitoring network interfaces, CPU, memory and network interfaces statistics.

mrtg

Regarding its features, we can list the following:

  • It works on most UNIX platforms and Windows NT.
  • It is written with Perl and delivered with full source.
  • No need to install any external SNMP package since MRTG uses a highly portable SNMP implementation written fully in Perl.
  • It creates visual representations of the traffic seen during the last week, month and year.
  • It is possible to monitor 200 or more network links from any halfway decent UNIX box.
  • It is also possible to monitor any SNMP and to assemble to data sources in one graph.

The description of our selected free monitoring systems in this article now is finished. Of course, there are other tools we don’t mention, if you want to include them in our article please feel free to leave a comment here with a brief description of the suggested tools. Thank you for reviewing our article and please don’t forget to share it.


Advertise here with BSA

---------------------------------------------------------------------
List of Free And Open Source Monitoring System

Top 5 System Performance Monitoring Tools For Linux Admins

$
0
0


There are some tools which we must know as Linux/Server Admin to monitor the health/performance status of any running Server. Generally we have to monitor health/status of  RAM, CPU, I/O Devices and Network. Our demo is performed with Ubuntu Server 14.04. There are many System Performance Monitoring Tools For Linux, but these are the often used tools.

Let us have a look.

1. TOP

A very important tools for all Linux users, This command displays activities of CPU and RAM in Real Time.

top

TOP

List of process are displayed by default on CPU utilization bases, press “<” or “>”to change parameters, you can use “z” key to get the colorful display so that you can monitor processes easily.

Z+top

Pressing of “f” key can toggle parameters you wants to include in the output of “top” command.

top+f

Even you can kill any running process with  pressing “k”, give the  desired PID argument to kill concerned process.

top+k

2. IOSTAT

iostat is a very important performance analysis command used to get I/O Devices, CPU and Network based statistics.

iostat

iostat

In output,

  • tps – transition per second
  • kB_read – data read per second in kB
  • kB_wrtn – Data Write per second in kB.

Have a look in your display which device is most active  and performing batter.

iostat 2 4

This command will display I/O Status  4 times after interval of every 2  seconds.

iostat 2 4

iostat -c

It will display only cpu  statistics.

iostat -c

3. IOTOP

Well, I have to install that utility, in most cases this utility is not available by default. This utility displace I/O Stastics consumed per process, let’s have a look.

apt-get install iotop && iotop

iotop

Let’s have some example- have a look in above snapshot that postgres has been listed as top most process, let’s perform some task.

dd if=dev/sda of=dev/zero&
iotop

You will observer that above process is consuming maximum I/O resources.

iotop dd

Don’t forget to kiil dd command after your testing is done!

killall dd

 4. VMSTAT

Virtual Memory Status,  Displays information about memory  status, it comes with sysstat utility.

apt-get install sysstat && vmstat

vmstat

in output,

  • si – swam in
  • so – swap out
  • bi – block in (Data reading speed)
  • bo – block out (data writing speed)

It’s a very useful tool to get information about swap memory of the system.

vmstat -s

This command provides detailed memory status.

vmstat -s

5. SAR

System Activity Report comes with sysstat utility. This tool is very important because it stores the information in history from some specific time period. sar  data is generated through cron jobs in /etc/cron.d/sysstat.

cat /etc/cron.d/sysstat

sar_cron

This cron job  collects data  every 10 minute/day then it collects  data for long term record once in the midnight  of every day and data is written in /var/log/sysstat/sa. Now, sar utility is used to read /var/log/sysstat/sa data.Additionally, history parameters are stored in /etc/sysstat/sysstat file in ubuntu.

cat /etc/sysstat/sysstat

sar file

‘-A’ option will display a very detailed information about I/O Devices, CPU, Memory and Network stats.

sar -A

‘-d’ option will print I/O devices status.

sar -d

‘-q’ option will display cpu average load.

sar -q

‘-S’ option will display swap status.

sar -S

‘-n’ DEV option will display current network status

sar -n DEV

sar -n DEV

Hope these tools will be useful for you.

Have fun!!

---------------------------------------------------------------------
Top 5 System Performance Monitoring Tools For Linux Admins

Monitoring Your Drupal Website Using Centreon

$
0
0


Introduction

Centreon is an Open Source software package that lets you supervise all the infrastructure and applications comprising your information system.

CES Standard is the Open and free version of the product. Centreon Enterprise Server (CES) includes all Centreon functions in a unique product.

For more information, you can visit the website of Centreon, and check our article in this link .

Purpose and Target Audience

This article describes how to monitor your drupal website with Centreon using Nagios Monitoring Module. The Nagios monitoring

Module can be obtained from direct download from the Drupal Module downloads page at https://www.drupal.org/project/nagios.

The Nagios Monitoring Module  must be installed on the website server and configured before Centreon  can monitor the drupal website.

This article is intended for use by Centreon Administrators who want to monitor drupal website with Centreon.

If you still didn’t install Centreon, check this article to see how to do that.

Pre-requisites

To be able to make the configurations in this article you’ll need admin access on both the Drupal server and on the Centreon system. You will need to install a Drupal module and then install a Nagios plugin.

About Nagios Monitoring Module

In this article,  you be able to use the nagios monitoring module to monitor your Drupal CMS installation. With this module you’ll be able use Centreon to tell you if your Drupal website is running as expected, including:

  • PHP is parsing scripts and modules correctly (in case PHP gets disabled for some reason)
  • The database is accessible from Drupal
  • Whether there are configuration issues with the site, such as:
    • Pending Drupal version or module updates
    • Unwritable ‘files’ directory
    • Pending updates to the database schema
    • Cron not running for a specified period
    • Anything else reported in the Administer -> Reports -> Status report (requirements)

Configure Nagios Monitoring Module On the Drupal Website

Firstly you will need to go to drupal.org and download the Nagios monitoring module.

Add the module to your Drupal server by either copying the file to your server and moving it to the “../modules/” folder,  then extracting (tar –zxvf nagios-7.x-1.2.tar.gz) or navigate to your Drupal GUI and via the “Modules” page, click “Install new module” and paste the hyperlink above.

Sans titre

Once the module is installed you will need to activate it and then configure it.Firstly navigate to the modules page and find the “Nagios monitoring” module in the “Monitoring section”, then enable it.

Next, after enabling the module, you must configure it. On Drupal Version 7, navigate to “Configuration > System > Nagios Monitoring”.

Sans titre

On this page, you need to set the “Unique ID” for the Drupal site, as this example :

Sans titre

Drupal website is now configured and ready for monitoring with Centreon.

Configure Centreon with command Line

First step to do is to download the “check_drupal” plugin from the Nagios Exchange and copy it to your Centreon system. It’s useful to be familiar with running your plugin from the command line, for both informational and debugging purposes.

On the Centreon server, move the plugin to “/usr/local/nagios/libexec” and ensure the permissions are correctly set

chown nagios:nagios /usr/local/nagios/libexec/check_drupal
chmod +x /usr/local/nagios/libexec/check_drupal

The next step is to run a test command using the unique ID you set above.

$ ./check_drupal -U drupalunixmen -H 172.16.0.15/unixmen
DRUPAL CRITICAL, ADMIN:CRITICAL=Configuration file, Drupal core update status, CRON:OK | SAN=0;SAU=1;NOD=1;USR=1;MOD=34;THM=4

As above, you can now see that the plugin is talking to the Drupal module correctly.

If you see an error such as:

$ ./check_drupal -H 192.168.0.16/unixmen
wget error: 8: when accessing 192.168.0.16/unixmen/nagios. HTTP:   HTTP/1.0 404 Not Found

Then the “-U uniqueid” is not specified in the command, or set via the Drupal module.

As the test is successful you can now proceed to building service checks to monitor your Drupal site with the Centreon Gui.

Configuring Centreon to Monitor the Drupal Website

Once the installation of Drupal Monitoring Module is done, it’s about time we start with the configuration of our objects.

Log into the web interface via : http://[SERVER_IP]/centreon and enter your login information.

Host configuration

First step to do is to add the Website host.

Go under  « Configuration → Hosts → Add »:

host_conf_1

In the general information, fill out the fields: :

Sans titre

Enter the information regarding the polling strategy:

host_conf_3

Our host will then be checked every 5 minutes and an alert will be sent out 4 minutes after our host goes « DOWN » (2 check attempts with 1 check every 2 minutes will confirm its « HARD » state). The notification will be effective during the time period of 24 hours a day, 7 days a week.

At last, the notification parameters are as follows:

host_conf_4

Then, click on « Save ».

Services configuration

The configuration of our host is now done; all we have left to do is add the definitions of our services. In order to do so,

Go to « Configuration → Services → Services by hosts → Add »:

service_conf_1

In the « Relations » tab, select the host that was previously created, then click on « Save »:

Sans titre

Generation of configuration files

Once the hosts and services are created and properly configured, it is required to generate the configuration files through two steps:

• configuration testing;
• configuration export.

Go to the « Configuration → Monitoring Engines → Generate » menu:

generate_conf_1

First, select the monitoring poller from the dropdown menu, check the first two check-boxes, and then click on the « Export » button:

generate_conf_2

If the output is the test is « Generating files… OK », then you can go to step #2. Otherwise, it is required to fix the problems which should be displayed in the console.

Now, check the two other check-boxes and click on the « Export » button again:

generate_conf_3

If the export process is successful, you should see the following displayed: “Restarting engine… OK

That’s all. We hope that this article help you to monitor your drupal website.

---------------------------------------------------------------------
Monitoring Your Drupal Website Using Centreon

Install LibreNMS New Fork From Observium

$
0
0


LibreNMS is an autodiscovering PHP/MySQL/SNMP based network monitoring tool which includes support for a wide range of network hardware and operating systems including Cisco, Linux, FreeBSD, Juniper, Brocade, Foundry, HP and many more. LibreNMS is a community-based fork of Observium.

LibreNMS has many features:

  • Automatic discovery: Automatically discover your entire network using CDP, FDP, LLDP, OSPF, BGP, SNMP and ARP.
  • Customizable alerting: Highly flexible alerting system, notify via email, irc, slack and more.
  • Distributed Polling: Horizontal scaling to grow with your network.
  • Plugin system: LibreNMS has plugin system that enables you to extend your install for your needs.

This tutorial will cover the installation process of LibreNMS  on RHEL/CentOS/ based systems with the minimal configurations needed to be done.

Requirements

In this article we assume that you have made a fresh install for Centos server and you are the root user. If you are not, prepend sudo to all shell commands or temporarily become a user with root privileges with sudo -s.

Database configuration

LibreNMS is based on LAMP Server (Mysql, apache and php). The first step that we will do it is to install mysql server and configure the database for LbreNMS.

yum install net-snmp mysql-server 
service snmpd start 
service mysqld start 
chkconfig --levels 235 mysqld on 
chkconfig --levels 235 snmpd on

Now  after installing the mysql server you need to secure using the mysql secure script.

mysql_secure_installation

Now you can set up the mysql user and database for LibreNMS.

You need to have the password of the MySQL root user.

Log into MySQL:

mysql -u root -p

After successful authenticated, you need to create the database for the WordPress Website.

CREATE DATABASE librenms;

The database Name is librenms. You will need this information later.

Now, you should create the database administrator.

CREATE USER librenmsadmin@localhost IDENTIFIED BY 'librenmspassword';

Next, you need to give this user  permissions to administer the database you created.

GRANT ALL PRIVILEGES ON librenms.* TO librenms@localhost;

You need to flush the privilege information to disk to activate the new MySQL user:

FLUSH PRIVILEGES;
exit

If your database is on the same server as LibreNMS, you can just use localhost as the IP address. If you are deploying a separate database server you must change localhost above with the IP of the server running LibreNMS. And also you need to change you need to change the bind-address.

vim /etc/my.cnf

Add the following line:

bind-address = <ip>

Change <ip> to the IP address that your MySQL server should listen on. Restart MySQL:

service mysqld restart

LibreNMS Installation

Before we download the LibreNMS package you need to install some prerequisite software.

The packages listed below are an all-inclusive list of packages that were necessary on a clean install of CentOS 6.5. It also requires the EPEL repository.

if not using HTTPd (Apache): RHEL requires httpd to be installed regardless of of nginx‘s (or any other web-server’s) presence.

rpm -Uvh http://download.fedoraproject.org/pub/epel/6/i386/epel-release-6-8.noarch.rpm
yum install php php-cli php-gd php-mysql php-snmp php-pear php-curl httpd net-snmp graphviz graphviz-php mysql ImageMagick jwhois nmap mtr rrdtool MySQL-python net-snmp-utils vixie-cron php-mcrypt fping git
pear install Net_IPv4-1.3.4
pear install Net_IPv6-1.2.2b2

Next step is to add the librenms-user.

useradd librenms -d /opt/librenms -M -r
usermod -a -G librenms apache

Then make sure that you set httpd to start on system boot.

chkconfig --levels 235 httpd on

Next, add the following to /etc/httpd/conf.d/librenms.conf

<VirtualHost *:80>
  DocumentRoot /opt/librenms/html/
  ServerName  librenms.example.com
  CustomLog /opt/librenms/logs/access_log combined
  ErrorLog /opt/librenms/logs/error_log
  AllowEncodedSlashes On
  <Directory "/opt/librenms/html/">
    AllowOverride All
    Options FollowSymLinks MultiViews
  </Directory>
</VirtualHost>

If you are running Apache 2.2.18 or higher then change AllowEncodedSlashes to NoDecode and append Require all granted underneath Options FollowSymLinks MultiViews.

In this stage, you can clone the repository via HTTPS or SSH. In either case, you need to ensure the appropriate port (443 for HTTPS, 22 for SSH) is open in the outbound direction for your server.

cd /opt
git clone https://github.com/librenms/librenms.git librenms
cd /opt/librenms

The recommended method of cloning a git repository is HTTPS. If you would like to clone via SSH instead, use the command

cd /opt
git clone git@github.com:librenms/librenms.git librenms instead
cd /opt/librenms

At this stage you can either launch the web installer by going to http://IP/install.php, follow the on-screen instructions then skip to the ‘Web Interface’ section further down.

Alternatively if you want to continue the setup manually then just keep following these instructions.

cp config.php.default config.php
vim config.php

Change the values to the right of the equal sign for lines beginning with $config[db_] to match your database information as setup above.

Change the value of $config['snmp']['community'] from public to whatever your read-only SNMP community is. If you have multiple communities, set it to the most common.

Add the following line to the end of config.php:

$config['fping'] = "/usr/sbin/fping";

Be sure you have no characters (including whitespace like: newlines, spaces, tabs, etc) outside of the<?php?> blocks. Your graphs will break otherwise.

Now you need to initialize the database.

php build-base.php

Now it’s time to create th admin user with privilege should be 10. Substitute your desired username and password–and leave the angled brackets off.

php adduser.php <name> <pass> 10

To prepare the web interface (and adding devices shortly), you’ll need to create and chown a directory as well as create an Apache vhost.

First, create and chown the rrd directory and create the logs directory

mkdir rrd logs
chown apache:apache logs
chmod 775 rrd
chown librenms:librenms rrd

Start the web-server:

service httpd restart
Add localhost
php addhost.php localhost public v2c

This assumes you haven’t made community changes–if you have, replace public with your community. It also assumes SNMP v2c.

Discover localhost and poll it for the first time:

php discovery.php -h all && php poller.php -h all

Create cronjob

The polling method used by LibreNMS is poller-wrapper.py, which was placed in the public domain by its author. By default, the LibreNMS cronjob runs poller- wrapper.py with 16 threads. The current LibreNMS recommendation is to use 4 th reads per core. The default if no thread count is 16 threads.

If the thread count needs to be changed, you can do so by editing the cron file (/etc/cron.d/librenms). Just add a number after poller-wrapper.py, as in the below example:

/opt/librenms/poller-wrapper.py 12 >> /dev/null 2>&1

Create the cronjob

cp librenms.nonroot.cron /etc/cron.d/librenms

LibreNMS performs daily updates by default. At 00:15 system time every day, a git pull –no-edit –quiet is performed. You can override this default by edit ing your config.php file. Remove the comment (the # mark) on the line:

#$config['update'] = 0;

so that it looks like this:

$config['update'] = 0;

That’s it! You now should be able to log in to http://librenms.example.com/.

LibreNMS

Screenshots

LIBRE LIBREE

That’s all for now. Thanks for visiting Unixmen. Stay tuned with us.

---------------------------------------------------------------------
Install LibreNMS New Fork From Observium

Send Nagios Alert Notification Using SMS

$
0
0


Introduction

One of the most important feature of the monitoring platform is the notification system; by default  they use the local mail daemon (postfix, mail, exim) installed on the server to send the notifications.

Using local mail daemon has many issues :

  • You need to install and configure your smtp server.
  • Maybe your mail server go down so you can’t receive the alert.
  • Maybe this kind of emails from a not verified source like nagios can be filtered by the same company antispam system.

In order to avoid all issues, In this article I am going to explain how to send alert from monitoring tool Nagios Core using SMS.

This task was not so easy since communicating with the smsgateway through a linux server was requiring to install smstools.

If you still didn’t install Nagios Core , check the following articles.

Install SmsTools

The SMS Server Tools are made to send and receive short messages through GSM modems. It supports easy file interfaces and it can run external programs for automatic actions.

To be able to send SMS in a team with Linux will need the following:

  • A modem GSM GPRS.
  • A card SIM mobile with data activated to be able to send SMS. It is convenient to review that the sending of SMS works properly inserting the card SIM in a mobile and sending a SMS .
  • Coverage of the mobile network in the zone where place the modem GSM: obviously it has to have coverage of the mobile network so that it work the sending of SMS from the modem GSM.

Then you insert the card SIM in the modem GSM and will connect the modem GSM by USB to the server where nagios is hosted.

In this tuto we will show to how to configure Nagios to send sms hosted in Vmware.

Next step is to add usb controller to the nagios server.

1

Then choose your mobile phone.

2

Then check your configuration using dmesg | grep tty. You should see usb port (ttyACM0)

3

Now you need to install the smstool under nagios server using the flowing command in centos:

yum install smstools

Make Sure you have the Following SMSTOOLS3 SERVER Files and Folders Installed

  • incoming = /var/spool/sms/incoming
  • outgoing = /var/spool/sms/outgoing
  • checked = /var/spool/sms/checked
  • failed = /var/spool/sms/failed
  • sent = /var/spool/sms/sent
  • logfile = /var/log/smsd.log
  • Configuration = /etc/smsd.conf

Also make sure that SMSTools has the Right Configuration Setting for your modem in:  /etc/smsd.conf
( GSM Modem is on ttyACM0 in this example)

device = /dev/ttyACM0

Next step is to configure smstool service to autorun with the server.

chkconfig smsd on

Then restart the service using this command:

service smsd restart

Then you can test to send sms

sendsms 12128654549 'test'

Nagios Configuration

After this go under /usr/local/nagios/etc/objects/ and edit the file commands.cfg but that perform a backup of the config file:

cd /usr/local/nagios/etc/objects/
cp commands.cfg commands.cfg.old
Edit the commands.cfg file and you will add two commands ‘notify-host-by-sms’ and ‘notify-service-by-sms’
notify-host-by-sms
/usr/bin/printf “%b” ” hostname : $HOSTNAME$ State: $HOSTSTATE$ Address: $HOSTADDRESS$ Date/Time: $DATE$ ” | smssend $CONTACTPAGER$

notify-host-by-whatsapp

/usr/bin/printf “%b” ” $SERVICEDESC$ State: $SERVICESTATE$ Date/Time: $LONGDATETIME$ ” | smssend $CONTACTPAGER$

And we should define the contact under contacts.cfg file like this example

contact_name                    admin
        use                             generic-contact
        alias                           Admin 
        email                           admin@unixmen.com
        pager                       xxxxxxxxxxxxxxxxxxxxx
        service_notification_commands   notify-service-by-email notify-service-by-sms
        host_notification_commands      notify-host-by-email notify-host-by-sms

Now the configuration is finished. Before applying the new configuration, run the following command to check for any error or mistake:

/usr/local/nagios/bin/nagios -v /usr/local/nagios/etc/nagios.cfg

If there are no errors, restart the nagios service:

service nagios restart


The post Send Nagios Alert Notification Using SMS appeared first on Unixmen.

How To Install NConf To Manage Nagios Core

$
0
0


About NConf

NConf is a PHP based web-tool for configuring the Nagios monitoring software. It differs from similar tools by offering enterprise-class features like templates, service to hostgroup assignment, dependencies and the ability to configure a large-scale, distributed Nagios server topology.

If you still didn’t install Nagios Core , check the following articles.

This guide will help you get started with NConf. It begins with an overview of NConf & Nagios, how to install NConf and shows you how to setup.

Features

The main NConf features include:

  • effortlessly maintain a distributed Nagios topology
  • user-friendly web-GUI based on jQuery
  • host & service templates
  • service to hostgroup assignment
  • host- & service-dependencies, auto-generated service dependencies
  • graphical parent/child relationship viewer
  • multiple authentication modes (LDAP, AD, SQL, local)
  • deployment mechanism supports multiple protocols (SCP, rsync, HTTPs, local)
  • Nagios config import
  • CSV file import / export
  • Perl database API
  • data schema customizable and extendable via the GUI
  • runs on Linux / Apache / PHP / MySQL

Requirements

  • Apache webserver
  • PHP 5.x or higher, php-mysql, php-ldap (only if using LDAP auth)
  • MySQL 5.0.2 or higher (with InnoDB!)
  • Perl 5.6 or higher, perl-DBI, perl-DBD-MySQL
  • Nagios 3.x or Icinga 0.8x (binary required to run syntax checks)

To install those requirements under centos you can use this command:

yum install mysql-server perl-DBI perl-DBD-MySQL php-mysql sudo -y

php.ini settings:

  • short_open_tag = On
  • register_globals = Off
  • magic_quotes_gpc = Off

Compatibility:

NConf has been tested on Red Hat, Fedora and CentOS Linux.
It has not been tested on Windows or any UNIX, nor with SELinux.

Let’s start.

NConf Installation

First step to do is to download the NConf archive from this link. Upload it onto a webserver of your choice.

Upload the uncompressed archive to your server and uncompress it there using this command

tar -zxvf nconf-VERSION.tgz
The second step is to move the content of nconf folder to your webserver dierctory and make sure the following directories are writable to your webserver user.
mv nconf-VERSION/* /usr/local/nagios/share/nconf

Give permission to the webserver user on nconf folder

chmod  775 /usr/local/nagios/share/nconf/bin/*

Database and MySQL user creation for NConf

You start the setup of NConf by setting up the mysql user and database.

You need to have the password of the MySQL root user.

Log into MySQL:

mysql -u root -p

After successful authenticated, you need to create the database for the Typo3 Website.

CREATE DATABASE nconf;

The database Name is typo. You will need this information later.

Now, you should create the database administrator.

CREATE USER nconfadmin@localhost IDENTIFIED BY 'nconfpassword';

Next, you need to give this user  permissions to administer the database you created.

GRANT ALL PRIVILEGES ON typo.* TO nconfadmin@localhost;

You need to flush the privilege information to disk to activate the new MySQL user:

FLUSH PRIVILEGES;
exit

NConf Web Installation

After finished the database creation , you need to restart your webserver using this command.

service httpd restart
Now, you can open openDCIM in your browser to proceed with the installation. If you have set up a DNS entry for a domain name to point to your web server’s IP, you will go to something similar to https://nagios.example.com/nagios/nconf/INSTALL.php. Otherwise, you can visit https://IP_of_web_server/nagios/nconf/INSTALL.php.
First step is pre-install check. The pre-install check will try to detect some requirements. If all checks are OK, you may safely proceed with the installation. If one or more checks fail, you may still proceed to install NConf, but it might not work properly.
nconf-1
Second step asks you for the MySQL information. Enter the required information like hostname, database name, username and password. Make sure you have created a new database and have given sufficent privileges to the user you’re connecting with.
nconf-2
Then you need to put the NConf directory.
nconf-4
Next step is to activate basic authentication for NConf. More sophisticated authentication methods are available, but these must be configured manually after completing the installation.
nconf-5
After the installation is complete, remove the following files and directories:
  • INSTALL
  • INSTALL.php
  • UPDATE
  • UPDATE.php

nconf-6

Else you will get this error.

nconf-7

The final step is to log under Nconf using your logins inforamtions.

nconf-8

That’s all for this artilce. For more information about using Nconf please visit http://www.nconf.org.

Thanks.

The post How To Install NConf To Manage Nagios Core appeared first on Unixmen.

Network Monitoring Tools You Have To Know

$
0
0


We all understand how system administrators love to have network monitoring tools which make their lives easier. Following is a list of the best tools for monitoring devices, ports or protocols, services, and for analyzing traffic on the network. Even if the administrator may have used some of these tools before, I’m sure he will find at least a gem or two amongst this tools list.

GFI LanGuard

This tool is a complete vulnerability management solution that allows system administrators to scan, assess, detect, and rectify the security vulnerabilities on their network. GFI LanGuard provides the appropriate tools to remediate the vulnerabilities and to install the missing patches on the network. This tools also gives the system administrator a complete picture of his network set-up and helps him to maintain a secure network state more effectively and faster.

OpenNMS

This tool is an open source enterprise grade network management app, which offers an automated discovery, performance measurement, event and notification management, and also service assurance features. OpenNMS tool includes a client application for iPod Touch, iPhone, or iPad for “on-the-go access” which gives the system administrator the ability to view nodes, outages, alarms and also add a specific interface for monitoring.

Check the following article to know how to install OpenNMS in Ubuntu.

Fiddler

This is a web debugging tool which captures the HTTP traffic between selected computers and the Internet. Fiddler allows the system administrators to analyze outgoing and incoming data in order to modify and monitor responses and requests just before they hit the browser. This tool also gives system administrators an extremely detailed information about the HTTP traffic and may be also used for testing their websites’ performance or their web applications’ security testing (For instance, Fiddler can simply decrypt HTTPS traffic).

Ganglia

Ganglia is simply a scalable distributed network monitoring solution which is focused on grids and clusters. It gives system administrators an easy-to-read and quick overview of their entire clustered system. This tools can scale in order to handle clusters with up to 2,000 nodes. Ganglia has been ported to various platforms and is also used on thousands of clusters worldwide. Any system administrator who employs server clusters should have this tool in order to monitor that system.

Check the following article to know how to install Ganglia in Debian and Ubuntu.

WireShark

Our tools list couldn’t be complete without WireShark. This tool is simply a capture utility and an interactive network protocol analyzer. WireShark provides for in-depth inspection of 100s of protocols and also runs on multiple platforms.

Pandora FMS

This tool is a network monitoring, performance monitoring, and also availability management tool which keeps an eye on applications, servers, and communications too. Pandora FMS has an advanced event correlation system which can allow the system administrator to create alerts according to events from various sources and then notify administrators before any issue escalates.

Check the following links to install Pandora FMS in CentOS.

Microsoft Network Monitor

This is another network monitoring tool and is a packet analyzer which allows system administrators to view, capture, and analyze their network traffic. This handy tool is the best option for troubleshooting their network problems and/or applications on their network. The main features of this tool include simultaneous capture sessions, support for over 300 Microsoft proprietary and public protocols, Wireless Monitor Mode, and also sniffing of the promiscuous mode traffic.

Advanced IP Scanner

This small tool is easy to use and fast network scanner which detects any kind of network devices such as wireless devices including printers, mobile phones, and also WIFI routers on the network. Advanced IP Scanner allows system administrators to connect to the common services including HTTP, FTP, and also shared folders in case if they are enabled on the remote machine. System admin is also able to wake up and shut down remote computers anytime.

Zabbix

This tool is as powerful as all other network monitoring tools, as it offers mapping on its Web-based console, user-defined views, and zooming. It also collects nearly ANY kind of data you want to monitor, offers an agent-less monitoring, can monitor up to 10,000 devices, and it does the availability and SLA reporting. The administrator can also get commercial support for this outstanding product. A unique Zabbix feature is an option to set the audible alerts.

Check the following links to install Zabbix on CentOS and Ubuntu.

NetworkMiner

This tool is able to capture network packets and then parse data in order to extract files and images which help system administrators to reconstruct events which users have taken on the network. NetworkMiner can also do that by simply parsing the pre-captured PCAP file. The system administrator can enter keywords that will be highlighted as the network packets are captured. This tool is classed as NFAT (Network Forensic Analysis Tool) which can obtain information including operating system, hostname, and open ports from the hosts.

PRTG Network Monitor Freeware

This network monitoring tool can monitor the network availability and usage by using different protocols such as Netflow, SNMP, and WMI. PRTG Network Monitor is a powerful tool which offers an easy to use web-based interface and applications for Android and iOS. Amongst other network tools, this tool’s key features include:

  • Flexible Alerting: It has 9 different methods for notifications, conditional alerts, limit alerts, status alerts, threshold alerts, and alert scheduling.
  • Comprehensive Network Monitoring: This offers about 170 sensor types or even more for application monitoring, SLA monitoring, virtual server monitoring, and QoS monitoring.
  • In-Depth Reporting: This includes the ability of scheduling reports, creating reports in HTML/PDF format, as well as the pre-defined reports and report templates.

Nagios

This tool is considered by thousands of system administrators as the king of the open source network monitoring solutions. But at the same time it isn’t the easiest tool to set up or to configure as you must edit configuration files manually. The idea behind the manual configuration is to turn some features off, which actually makes this tool one of the most flexible network monitors ever.

Check the following links to install nagios on CentOS and Ubuntu.

Capsa Free

This tool is a network analyzer which allows system administrators to troubleshoot network issues, monitor network traffic, and analyze packets. Features of this tool include MSN and Yahoo Messenger filters, support for over 300 network protocols, auto-save, email monitoring, ability to create and customize protocols, and customizable dashboards and reports.

Zenoss Core

Another powerful open source IT monitoring platform which can monitor servers, networking, applications, storage, and virtualization in order to provide performance statistics and availability. The tool has also high-performance event handling system as well as an advanced notification system.

The Dude

This friendly tool is another network monitoring tool which can monitor alerts you when there is any problem with devices. The tool automatically scans all the devices on a chosen subnet and then layout and draw maps of your network.

Angry IP Scanner

This standalone application can facilitate the IP address and port scanning. Angry IP Scanner is used for scanning a range of IP addresses in order to find hosts which are alive and obtain information about them such as open ports, MAC address, hostname, NetBIOS information, ping time, etc.

Check the following link to install Angry IP Scanner in CentOS and Ubuntu.

Total Network Monitor

This tool can continuously monitor services and hosts on the local network, and then notify you of any issue which requires your attention via a very detailed report of the problem. The result of each probe can be classified using red, green, or black colors in order to quickly show whether that probe was successful, wasn’t able to complete, or had a negative result.

Xymon

This is a web-based system which is designed to run on Unix-based systems, allowing you to dive deeper into performance, configurations, and real-time statistics of the networking environment. The tool also offers monitoring capabilities with reporting, performance graphs, and historical data.

Xirrus Wi-Fi Inspector

From its name, you can understand that this tool can be used to search for Wi-Fi networks, locate Wi-Fi devices, verify Wi-Fi coverage, manage and troubleshoot connections, and also detect rogue Access Points. Xirrus Wi-Fi Inspector usually comes with built-in speed tests, quality, and connection.

Splunk

This can be considered as data analysis and collection platform which will allow the system administrator to monitor, gather, and analyze data from various sources on the network such as TCP/UDP traffic, devices, event logs, services, etc. The system administrator can set up alerts to be notified when something went wrong or he can use Splunk’s reporting, extensive search, and dashboard features in order to make the most of those collected data. This platform will also allow him to install ‘Apps’ in order to extend system functionality.

Icinga 2

This application is another Linux based fully open source network monitoring application that will check the availability of network resources and can immediately notify users when something is down. The application also provides a powerful command line interface, BI (business intelligence) data for in-depth analysis.

Check the following article to install Icinga 2.

WirelessNetView

This is a lightweight utility, which is available as an installation package or as a standalone executable, which will monitor the activity of the reachable wireless networks and then it will display information related to them including Signal Quality, SSID, Channel Number, MAC Address, Cipher Algorithm, etc.

Spiceworks

Spiceworks is a fast growing tool which becomes one of the industry standard free system/network monitoring tools. Although, as it is a free tool, it comes with some ads, its features, and its Web-based interface can’t be beaten comparing to other tools. This outstanding tool will monitor and auto-discover all your systems, offer outstanding topographical tools, and will alert you in case if something is down. Spiceworks also allows system administrators to get social with fellow IT pros through the Spiceworks community that is now built right in.

I’m pretty sure that every reader at least used, or is using, at least one on these outstanding free network monitoring tools. If you think that I didn’t cover all available tools that are rated by thousands of system administrators all over the world and other simple users, then comment down please your tool and tell us why you prefer to use it not what I listed above.

The post Network Monitoring Tools You Have To Know appeared first on Unixmen.


Monitoring Your Drupal Website Using Centreon

$
0
0

Introduction

Centreon is an Open Source software package that lets you supervise all the infrastructure and applications comprising your information system.

CES Standard is the Open and free version of the product. Centreon Enterprise Server (CES) includes all Centreon functions in a unique product.

For more information, you can visit the website of Centreon, and check our article in this link .

Purpose and Target Audience

This article describes how to monitor your drupal website with Centreon using Nagios Monitoring Module. The Nagios monitoring

Module can be obtained from direct download from the Drupal Module downloads page at https://www.drupal.org/project/nagios.

The Nagios Monitoring Module  must be installed on the website server and configured before Centreon  can monitor the drupal website.

This article is intended for use by Centreon Administrators who want to monitor drupal website with Centreon.

If you still didn’t install Centreon, check this article to see how to do that.

Pre-requisites

To be able to make the configurations in this article you’ll need admin access on both the Drupal server and on the Centreon system. You will need to install a Drupal module and then install a Nagios plugin.

About Nagios Monitoring Module

In this article,  you be able to use the nagios monitoring module to monitor your Drupal CMS installation. With this module you’ll be able use Centreon to tell you if your Drupal website is running as expected, including:

  • PHP is parsing scripts and modules correctly (in case PHP gets disabled for some reason)
  • The database is accessible from Drupal
  • Whether there are configuration issues with the site, such as:
    • Pending Drupal version or module updates
    • Unwritable ‘files’ directory
    • Pending updates to the database schema
    • Cron not running for a specified period
    • Anything else reported in the Administer -> Reports -> Status report (requirements)

Configure Nagios Monitoring Module On the Drupal Website

Firstly you will need to go to drupal.org and download the Nagios monitoring module.

Add the module to your Drupal server by either copying the file to your server and moving it to the “../modules/” folder,  then extracting (tar –zxvf nagios-7.x-1.2.tar.gz) or navigate to your Drupal GUI and via the “Modules” page, click “Install new module” and paste the hyperlink above.

Sans titre

Once the module is installed you will need to activate it and then configure it.Firstly navigate to the modules page and find the “Nagios monitoring” module in the “Monitoring section”, then enable it.

Next, after enabling the module, you must configure it. On Drupal Version 7, navigate to “Configuration > System > Nagios Monitoring”.

Sans titre

On this page, you need to set the “Unique ID” for the Drupal site, as this example :

Sans titre

Drupal website is now configured and ready for monitoring with Centreon.

Configure Centreon with command Line

First step to do is to download the “check_drupal” plugin from the Nagios Exchange and copy it to your Centreon system. It’s useful to be familiar with running your plugin from the command line, for both informational and debugging purposes.

On the Centreon server, move the plugin to “/usr/local/nagios/libexec” and ensure the permissions are correctly set

chown nagios:nagios /usr/local/nagios/libexec/check_drupal
chmod +x /usr/local/nagios/libexec/check_drupal

The next step is to run a test command using the unique ID you set above.

$ ./check_drupal -U drupalunixmen -H 172.16.0.15/unixmen
DRUPAL CRITICAL, ADMIN:CRITICAL=Configuration file, Drupal core update status, CRON:OK | SAN=0;SAU=1;NOD=1;USR=1;MOD=34;THM=4

As above, you can now see that the plugin is talking to the Drupal module correctly.

If you see an error such as:

$ ./check_drupal -H 192.168.0.16/unixmen
wget error: 8: when accessing 192.168.0.16/unixmen/nagios. HTTP:   HTTP/1.0 404 Not Found

Then the “-U uniqueid” is not specified in the command, or set via the Drupal module.

As the test is successful you can now proceed to building service checks to monitor your Drupal site with the Centreon Gui.

Configuring Centreon to Monitor the Drupal Website

Once the installation of Drupal Monitoring Module is done, it’s about time we start with the configuration of our objects.

Log into the web interface via : http://[SERVER_IP]/centreon and enter your login information.

Host configuration

First step to do is to add the Website host.

Go under  « Configuration → Hosts → Add »:

host_conf_1

In the general information, fill out the fields: :

Sans titre

Enter the information regarding the polling strategy:

host_conf_3

Our host will then be checked every 5 minutes and an alert will be sent out 4 minutes after our host goes « DOWN » (2 check attempts with 1 check every 2 minutes will confirm its « HARD » state). The notification will be effective during the time period of 24 hours a day, 7 days a week.

At last, the notification parameters are as follows:

host_conf_4

Then, click on « Save ».

Services configuration

The configuration of our host is now done; all we have left to do is add the definitions of our services. In order to do so,

Go to « Configuration → Services → Services by hosts → Add »:

service_conf_1

In the « Relations » tab, select the host that was previously created, then click on « Save »:

Sans titre

Generation of configuration files

Once the hosts and services are created and properly configured, it is required to generate the configuration files through two steps:

• configuration testing;
• configuration export.

Go to the « Configuration → Monitoring Engines → Generate » menu:

generate_conf_1

First, select the monitoring poller from the dropdown menu, check the first two check-boxes, and then click on the « Export » button:

generate_conf_2

If the output is the test is « Generating files… OK », then you can go to step #2. Otherwise, it is required to fix the problems which should be displayed in the console.

Now, check the two other check-boxes and click on the « Export » button again:

generate_conf_3

If the export process is successful, you should see the following displayed: “Restarting engine… OK

That’s all. We hope that this article help you to monitor your drupal website.

The post Monitoring Your Drupal Website Using Centreon appeared first on Unixmen.

Install LibreNMS New Fork From Observium

$
0
0

LibreNMS is an autodiscovering PHP/MySQL/SNMP based network monitoring tool which includes support for a wide range of network hardware and operating systems including Cisco, Linux, FreeBSD, Juniper, Brocade, Foundry, HP and many more. LibreNMS is a community-based fork of Observium.

LibreNMS has many features:

  • Automatic discovery: Automatically discover your entire network using CDP, FDP, LLDP, OSPF, BGP, SNMP and ARP.
  • Customizable alerting: Highly flexible alerting system, notify via email, irc, slack and more.
  • Distributed Polling: Horizontal scaling to grow with your network.
  • Plugin system: LibreNMS has plugin system that enables you to extend your install for your needs.

This tutorial will cover the installation process of LibreNMS  on RHEL/CentOS/ based systems with the minimal configurations needed to be done.

Requirements

In this article we assume that you have made a fresh install for Centos server and you are the root user. If you are not, prepend

sudo

to all shell commands or temporarily become a user with root privileges with

sudo -s

.

Database configuration

LibreNMS is based on LAMP Server (Mysql, apache and php). The first step that we will do it is to install mysql server and configure the database for LbreNMS.

yum install net-snmp mysql-server 
service snmpd start 
service mysqld start 
chkconfig --levels 235 mysqld on 
chkconfig --levels 235 snmpd on

Now  after installing the mysql server you need to secure using the mysql secure script.

mysql_secure_installation

Now you can set up the mysql user and database for LibreNMS.

You need to have the password of the MySQL root user.

Log into MySQL:

mysql -u root -p

After successful authenticated, you need to create the database for the WordPress Website.

CREATE DATABASE librenms;

The database Name is librenms. You will need this information later.

Now, you should create the database administrator.

CREATE USER librenmsadmin@localhost IDENTIFIED BY 'librenmspassword';

Next, you need to give this user  permissions to administer the database you created.

GRANT ALL PRIVILEGES ON librenms.* TO librenms@localhost;

You need to flush the privilege information to disk to activate the new MySQL user:

FLUSH PRIVILEGES;
exit

If your database is on the same server as LibreNMS, you can just use

localhost

as the IP address. If you are deploying a separate database server you must change localhost above with the IP of the server running LibreNMS. And also you need to change you need to change the

bind-address

.

vim /etc/my.cnf

Add the following line:

bind-address = <ip>

Change

&lt;ip&gt;

to the IP address that your MySQL server should listen on. Restart MySQL:

service mysqld restart

LibreNMS Installation

Before we download the LibreNMS package you need to install some prerequisite software.

The packages listed below are an all-inclusive list of packages that were necessary on a clean install of CentOS 6.5. It also requires the EPEL repository.

if not using HTTPd (Apache): RHEL requires

httpd

to be installed regardless of of

nginx

‘s (or any other web-server’s) presence.

rpm -Uvh http://download.fedoraproject.org/pub/epel/6/i386/epel-release-6-8.noarch.rpm
yum install php php-cli php-gd php-mysql php-snmp php-pear php-curl httpd net-snmp graphviz graphviz-php mysql ImageMagick jwhois nmap mtr rrdtool MySQL-python net-snmp-utils vixie-cron php-mcrypt fping git
pear install Net_IPv4-1.3.4
pear install Net_IPv6-1.2.2b2

Next step is to add the librenms-user.

useradd librenms -d /opt/librenms -M -r
usermod -a -G librenms apache

Then make sure that you set httpd to start on system boot.

chkconfig --levels 235 httpd on

Next, add the following to /etc/httpd/conf.d/librenms.conf

<VirtualHost *:80>
  DocumentRoot /opt/librenms/html/
  ServerName  librenms.example.com
  CustomLog /opt/librenms/logs/access_log combined
  ErrorLog /opt/librenms/logs/error_log
  AllowEncodedSlashes On
  <Directory "/opt/librenms/html/">
    AllowOverride All
    Options FollowSymLinks MultiViews
  </Directory>
</VirtualHost>

If you are running Apache 2.2.18 or higher then change

AllowEncodedSlashes

to

NoDecode

and append

Require all granted

underneath

Options FollowSymLinks MultiViews

.

In this stage, you can clone the repository via HTTPS or SSH. In either case, you need to ensure the appropriate port (443 for HTTPS, 22 for SSH) is open in the outbound direction for your server.

cd /opt
git clone https://github.com/librenms/librenms.git librenms
cd /opt/librenms

The recommended method of cloning a git repository is HTTPS. If you would like to clone via SSH instead, use the command

cd /opt
git clone git@github.com:librenms/librenms.git librenms instead
cd /opt/librenms

At this stage you can either launch the web installer by going to http://IP/install.php, follow the on-screen instructions then skip to the ‘Web Interface’ section further down.

Alternatively if you want to continue the setup manually then just keep following these instructions.

cp config.php.default config.php
vim config.php

Change the values to the right of the equal sign for lines beginning with

$config[db_]

to match your database information as setup above.

Change the value of

$config['snmp']['community']

from

public

to whatever your read-only SNMP community is. If you have multiple communities, set it to the most common.

Add the following line to the end of

config.php

:

$config['fping'] = "/usr/sbin/fping";

Be sure you have no characters (including whitespace like: newlines, spaces, tabs, etc) outside of the<?php?> blocks. Your graphs will break otherwise.

Now you need to initialize the database.

php build-base.php

Now it’s time to create th admin user with privilege should be 10. Substitute your desired username and password–and leave the angled brackets off.

php adduser.php <name> <pass> 10

To prepare the web interface (and adding devices shortly), you’ll need to create and chown a directory as well as create an Apache vhost.

First, create and chown the rrd directory and create the logs directory

mkdir rrd logs
chown apache:apache logs
chmod 775 rrd
chown librenms:librenms rrd

Start the web-server:

service httpd restart
Add localhost
php addhost.php localhost public v2c

This assumes you haven’t made community changes–if you have, replace public with your community. It also assumes SNMP v2c.

Discover localhost and poll it for the first time:

php discovery.php -h all && php poller.php -h all

Create cronjob

The polling method used by LibreNMS is

poller-wrapper.py

, which was placed in the public domain by its author. By default, the LibreNMS cronjob runs

poller- wrapper.py

with 16 threads. The current LibreNMS recommendation is to use 4 th reads per core. The default if no thread count is

16 threads

.

If the thread count needs to be changed, you can do so by editing the cron file (

/etc/cron.d/librenms

). Just add a number after

poller-wrapper.py

, as in the below example:

/opt/librenms/poller-wrapper.py 12 >> /dev/null 2>&1

Create the cronjob

cp librenms.nonroot.cron /etc/cron.d/librenms

LibreNMS performs daily updates by default. At 00:15 system time every day, a git pull –no-edit –quiet is performed. You can override this default by edit ing your config.php file. Remove the comment (the # mark) on the line:

#$config['update'] = 0;

so that it looks like this:

$config['update'] = 0;

That’s it! You now should be able to log in to http://librenms.example.com/.

LibreNMS

Screenshots

LIBRE LIBREE

That’s all for now. Thanks for visiting Unixmen. Stay tuned with us.

The post Install LibreNMS New Fork From Observium appeared first on Unixmen.

Send Nagios Alert Notification Using SMS

$
0
0

Introduction

One of the most important feature of the monitoring platform is the notification system; by default  they use the local mail daemon (postfix, mail, exim) installed on the server to send the notifications.

Using local mail daemon has many issues :

  • You need to install and configure your smtp server.
  • Maybe your mail server go down so you can’t receive the alert.
  • Maybe this kind of emails from a not verified source like nagios can be filtered by the same company antispam system.

In order to avoid all issues, In this article I am going to explain how to send alert from monitoring tool Nagios Core using SMS.

This task was not so easy since communicating with the smsgateway through a linux server was requiring to install smstools.

If you still didn’t install Nagios Core , check the following articles.

Install SmsTools

The SMS Server Tools are made to send and receive short messages through GSM modems. It supports easy file interfaces and it can run external programs for automatic actions.

To be able to send SMS in a team with Linux will need the following:

  • A modem GSM GPRS.
  • A card SIM mobile with data activated to be able to send SMS. It is convenient to review that the sending of SMS works properly inserting the card SIM in a mobile and sending a SMS .
  • Coverage of the mobile network in the zone where place the modem GSM: obviously it has to have coverage of the mobile network so that it work the sending of SMS from the modem GSM.

Then you insert the card SIM in the modem GSM and will connect the modem GSM by USB to the server where nagios is hosted.

In this tuto we will show to how to configure Nagios to send sms hosted in Vmware.

Next step is to add usb controller to the nagios server.

1

Then choose your mobile phone.

2

Then check your configuration using dmesg | grep tty. You should see usb port (ttyACM0)

3

Now you need to install the smstool under nagios server using the flowing command in centos:

yum install smstools

Make Sure you have the Following SMSTOOLS3 SERVER Files and Folders Installed

  • incoming = /var/spool/sms/incoming
  • outgoing = /var/spool/sms/outgoing
  • checked = /var/spool/sms/checked
  • failed = /var/spool/sms/failed
  • sent = /var/spool/sms/sent
  • logfile = /var/log/smsd.log
  • Configuration = /etc/smsd.conf

Also make sure that SMSTools has the Right Configuration Setting for your modem in:  /etc/smsd.conf
( GSM Modem is on ttyACM0 in this example)

device = /dev/ttyACM0

Next step is to configure smstool service to autorun with the server.

chkconfig smsd on

Then restart the service using this command:

service smsd restart

Then you can test to send sms

sendsms 12128654549 'test'

Nagios Configuration

After this go under /usr/local/nagios/etc/objects/ and edit the file commands.cfg but that perform a backup of the config file:

cd /usr/local/nagios/etc/objects/
cp commands.cfg commands.cfg.old
Edit the commands.cfg file and you will add two commands ‘notify-host-by-sms’ and ‘notify-service-by-sms’
notify-host-by-sms
/usr/bin/printf “%b” ” hostname : $HOSTNAME$ State: $HOSTSTATE$ Address: $HOSTADDRESS$ Date/Time: $DATE$ ” | smssend $CONTACTPAGER$

notify-host-by-whatsapp

/usr/bin/printf “%b” ” $SERVICEDESC$ State: $SERVICESTATE$ Date/Time: $LONGDATETIME$ ” | smssend $CONTACTPAGER$

And we should define the contact under contacts.cfg file like this example

contact_name                    admin
        use                             generic-contact
        alias                           Admin 
        email                           admin@unixmen.com
        pager                       xxxxxxxxxxxxxxxxxxxxx
        service_notification_commands   notify-service-by-email notify-service-by-sms
        host_notification_commands      notify-host-by-email notify-host-by-sms

Now the configuration is finished. Before applying the new configuration, run the following command to check for any error or mistake:

/usr/local/nagios/bin/nagios -v /usr/local/nagios/etc/nagios.cfg

If there are no errors, restart the nagios service:

service nagios restart

The post Send Nagios Alert Notification Using SMS appeared first on Unixmen.

How To Install NConf To Manage Nagios Core

$
0
0

About NConf

NConf is a PHP based web-tool for configuring the Nagios monitoring software. It differs from similar tools by offering enterprise-class features like templates, service to hostgroup assignment, dependencies and the ability to configure a large-scale, distributed Nagios server topology.

If you still didn’t install Nagios Core , check the following articles.

This guide will help you get started with NConf. It begins with an overview of NConf & Nagios, how to install NConf and shows you how to setup.

Features

The main NConf features include:

  • effortlessly maintain a distributed Nagios topology
  • user-friendly web-GUI based on jQuery
  • host & service templates
  • service to hostgroup assignment
  • host- & service-dependencies, auto-generated service dependencies
  • graphical parent/child relationship viewer
  • multiple authentication modes (LDAP, AD, SQL, local)
  • deployment mechanism supports multiple protocols (SCP, rsync, HTTPs, local)
  • Nagios config import
  • CSV file import / export
  • Perl database API
  • data schema customizable and extendable via the GUI
  • runs on Linux / Apache / PHP / MySQL

Requirements

  • Apache webserver
  • PHP 5.x or higher, php-mysql, php-ldap (only if using LDAP auth)
  • MySQL 5.0.2 or higher (with InnoDB!)
  • Perl 5.6 or higher, perl-DBI, perl-DBD-MySQL
  • Nagios 3.x or Icinga 0.8x (binary required to run syntax checks)

To install those requirements under centos you can use this command:

yum install mysql-server perl-DBI perl-DBD-MySQL php-mysql sudo -y

php.ini settings:

  • short_open_tag = On
  • register_globals = Off
  • magic_quotes_gpc = Off

Compatibility:

NConf has been tested on Red Hat, Fedora and CentOS Linux.
It has not been tested on Windows or any UNIX, nor with SELinux.

Let’s start.

NConf Installation

First step to do is to download the NConf archive from this link. Upload it onto a webserver of your choice.

Upload the uncompressed archive to your server and uncompress it there using this command


tar
-zxvf nconf-VERSION.tgz
The second step is to move the content of nconf folder to your webserver dierctory and make sure the following directories are writable to your webserver user.

mv nconf-VERSION/* <span class="crayon-o">/</span><span class="crayon-v">usr</span><span class="crayon-o">/</span><span class="crayon-v">local</span><span class="crayon-o">/</span><span class="crayon-v">nagios</span><span class="crayon-o">/</span><span class="crayon-v">share</span><span class="crayon-o">/</span><span class="crayon-v">nconf</span>

Give permission to the webserver user on nconf folder

chmod  775 /usr/local/nagios/share/nconf/bin/*

Database and MySQL user creation for NConf

You start the setup of NConf by setting up the mysql user and database.

You need to have the password of the MySQL root user.

Log into MySQL:

mysql -u root -p

After successful authenticated, you need to create the database for the Typo3 Website.

CREATE DATABASE nconf;

The database Name is typo. You will need this information later.

Now, you should create the database administrator.

CREATE USER nconfadmin@localhost IDENTIFIED BY 'nconfpassword';

Next, you need to give this user  permissions to administer the database you created.

GRANT ALL PRIVILEGES ON typo.* TO nconfadmin@localhost;

You need to flush the privilege information to disk to activate the new MySQL user:

FLUSH PRIVILEGES;
exit

NConf Web Installation

After finished the database creation , you need to restart your webserver using this command.

service httpd restart
Now, you can open openDCIM in your browser to proceed with the installation. If you have set up a DNS entry for a domain name to point to your web server’s IP, you will go to something similar to https://nagios.example.com/nagios/nconf/INSTALL.php. Otherwise, you can visit https://IP_of_web_server/nagios/nconf/INSTALL.php.
First step is pre-install check. The pre-install check will try to detect some requirements. If all checks are OK, you may safely proceed with the installation. If one or more checks fail, you may still proceed to install NConf, but it might not work properly.
nconf-1
Second step asks you for the MySQL information. Enter the required information like hostname, database name, username and password. Make sure you have created a new database and have given sufficent privileges to the user you’re connecting with.
nconf-2
Then you need to put the NConf directory.
nconf-4
Next step is to activate basic authentication for NConf. More sophisticated authentication methods are available, but these must be configured manually after completing the installation.
nconf-5
After the installation is complete, remove the following files and directories:
  • INSTALL
  • INSTALL.php
  • UPDATE
  • UPDATE.php

nconf-6

Else you will get this error.

nconf-7

The final step is to log under Nconf using your logins inforamtions.

nconf-8

That’s all for this artilce. For more information about using Nconf please visit http://www.nconf.org.

Thanks.

The post How To Install NConf To Manage Nagios Core appeared first on Unixmen.

Network Monitoring Tools You Have To Know

$
0
0

We all understand how system administrators love to have network monitoring tools which make their lives easier. Following is a list of the best tools for monitoring devices, ports or protocols, services, and for analyzing traffic on the network. Even if the administrator may have used some of these tools before, I’m sure he will find at least a gem or two amongst this tools list.

GFI LanGuard

This tool is a complete vulnerability management solution that allows system administrators to scan, assess, detect, and rectify the security vulnerabilities on their network. GFI LanGuard provides the appropriate tools to remediate the vulnerabilities and to install the missing patches on the network. This tools also gives the system administrator a complete picture of his network set-up and helps him to maintain a secure network state more effectively and faster.

OpenNMS

This tool is an open source enterprise grade network management app, which offers an automated discovery, performance measurement, event and notification management, and also service assurance features. OpenNMS tool includes a client application for iPod Touch, iPhone, or iPad for “on-the-go access” which gives the system administrator the ability to view nodes, outages, alarms and also add a specific interface for monitoring.

Check the following article to know how to install OpenNMS in Ubuntu.

Fiddler

This is a web debugging tool which captures the HTTP traffic between selected computers and the Internet. Fiddler allows the system administrators to analyze outgoing and incoming data in order to modify and monitor responses and requests just before they hit the browser. This tool also gives system administrators an extremely detailed information about the HTTP traffic and may be also used for testing their websites’ performance or their web applications’ security testing (For instance, Fiddler can simply decrypt HTTPS traffic).

Ganglia

Ganglia is simply a scalable distributed network monitoring solution which is focused on grids and clusters. It gives system administrators an easy-to-read and quick overview of their entire clustered system. This tools can scale in order to handle clusters with up to 2,000 nodes. Ganglia has been ported to various platforms and is also used on thousands of clusters worldwide. Any system administrator who employs server clusters should have this tool in order to monitor that system.

Check the following article to know how to install Ganglia in Debian and Ubuntu.

WireShark

Our tools list couldn’t be complete without WireShark. This tool is simply a capture utility and an interactive network protocol analyzer. WireShark provides for in-depth inspection of 100s of protocols and also runs on multiple platforms.

Pandora FMS

This tool is a network monitoring, performance monitoring, and also availability management tool which keeps an eye on applications, servers, and communications too. Pandora FMS has an advanced event correlation system which can allow the system administrator to create alerts according to events from various sources and then notify administrators before any issue escalates.

Check the following links to install Pandora FMS in CentOS.

Microsoft Network Monitor

This is another network monitoring tool and is a packet analyzer which allows system administrators to view, capture, and analyze their network traffic. This handy tool is the best option for troubleshooting their network problems and/or applications on their network. The main features of this tool include simultaneous capture sessions, support for over 300 Microsoft proprietary and public protocols, Wireless Monitor Mode, and also sniffing of the promiscuous mode traffic.

Advanced IP Scanner

This small tool is easy to use and fast network scanner which detects any kind of network devices such as wireless devices including printers, mobile phones, and also WIFI routers on the network. Advanced IP Scanner allows system administrators to connect to the common services including HTTP, FTP, and also shared folders in case if they are enabled on the remote machine. System admin is also able to wake up and shut down remote computers anytime.

Zabbix

This tool is as powerful as all other network monitoring tools, as it offers mapping on its Web-based console, user-defined views, and zooming. It also collects nearly ANY kind of data you want to monitor, offers an agent-less monitoring, can monitor up to 10,000 devices, and it does the availability and SLA reporting. The administrator can also get commercial support for this outstanding product. A unique Zabbix feature is an option to set the audible alerts.

Check the following links to install Zabbix on CentOS and Ubuntu.

NetworkMiner

This tool is able to capture network packets and then parse data in order to extract files and images which help system administrators to reconstruct events which users have taken on the network. NetworkMiner can also do that by simply parsing the pre-captured PCAP file. The system administrator can enter keywords that will be highlighted as the network packets are captured. This tool is classed as NFAT (Network Forensic Analysis Tool) which can obtain information including operating system, hostname, and open ports from the hosts.

PRTG Network Monitor Freeware

This network monitoring tool can monitor the network availability and usage by using different protocols such as Netflow, SNMP, and WMI. PRTG Network Monitor is a powerful tool which offers an easy to use web-based interface and applications for Android and iOS. Amongst other network tools, this tool’s key features include:

  • Flexible Alerting: It has 9 different methods for notifications, conditional alerts, limit alerts, status alerts, threshold alerts, and alert scheduling.
  • Comprehensive Network Monitoring: This offers about 170 sensor types or even more for application monitoring, SLA monitoring, virtual server monitoring, and QoS monitoring.
  • In-Depth Reporting: This includes the ability of scheduling reports, creating reports in HTML/PDF format, as well as the pre-defined reports and report templates.

Nagios

This tool is considered by thousands of system administrators as the king of the open source network monitoring solutions. But at the same time it isn’t the easiest tool to set up or to configure as you must edit configuration files manually. The idea behind the manual configuration is to turn some features off, which actually makes this tool one of the most flexible network monitors ever.

Check the following links to install nagios on CentOS and Ubuntu.

Capsa Free

This tool is a network analyzer which allows system administrators to troubleshoot network issues, monitor network traffic, and analyze packets. Features of this tool include MSN and Yahoo Messenger filters, support for over 300 network protocols, auto-save, email monitoring, ability to create and customize protocols, and customizable dashboards and reports.

Zenoss Core

Another powerful open source IT monitoring platform which can monitor servers, networking, applications, storage, and virtualization in order to provide performance statistics and availability. The tool has also high-performance event handling system as well as an advanced notification system.

The Dude

This friendly tool is another network monitoring tool which can monitor alerts you when there is any problem with devices. The tool automatically scans all the devices on a chosen subnet and then layout and draw maps of your network.

Angry IP Scanner

This standalone application can facilitate the IP address and port scanning. Angry IP Scanner is used for scanning a range of IP addresses in order to find hosts which are alive and obtain information about them such as open ports, MAC address, hostname, NetBIOS information, ping time, etc.

Check the following link to install Angry IP Scanner in CentOS and Ubuntu.

Total Network Monitor

This tool can continuously monitor services and hosts on the local network, and then notify you of any issue which requires your attention via a very detailed report of the problem. The result of each probe can be classified using red, green, or black colors in order to quickly show whether that probe was successful, wasn’t able to complete, or had a negative result.

Xymon

This is a web-based system which is designed to run on Unix-based systems, allowing you to dive deeper into performance, configurations, and real-time statistics of the networking environment. The tool also offers monitoring capabilities with reporting, performance graphs, and historical data.

Xirrus Wi-Fi Inspector

From its name, you can understand that this tool can be used to search for Wi-Fi networks, locate Wi-Fi devices, verify Wi-Fi coverage, manage and troubleshoot connections, and also detect rogue Access Points. Xirrus Wi-Fi Inspector usually comes with built-in speed tests, quality, and connection.

Splunk

This can be considered as data analysis and collection platform which will allow the system administrator to monitor, gather, and analyze data from various sources on the network such as TCP/UDP traffic, devices, event logs, services, etc. The system administrator can set up alerts to be notified when something went wrong or he can use Splunk’s reporting, extensive search, and dashboard features in order to make the most of those collected data. This platform will also allow him to install ‘Apps’ in order to extend system functionality.

Icinga 2

This application is another Linux based fully open source network monitoring application that will check the availability of network resources and can immediately notify users when something is down. The application also provides a powerful command line interface, BI (business intelligence) data for in-depth analysis.

Check the following article to install Icinga 2.

WirelessNetView

This is a lightweight utility, which is available as an installation package or as a standalone executable, which will monitor the activity of the reachable wireless networks and then it will display information related to them including Signal Quality, SSID, Channel Number, MAC Address, Cipher Algorithm, etc.

Spiceworks

Spiceworks is a fast growing tool which becomes one of the industry standard free system/network monitoring tools. Although, as it is a free tool, it comes with some ads, its features, and its Web-based interface can’t be beaten comparing to other tools. This outstanding tool will monitor and auto-discover all your systems, offer outstanding topographical tools, and will alert you in case if something is down. Spiceworks also allows system administrators to get social with fellow IT pros through the Spiceworks community that is now built right in.

I’m pretty sure that every reader at least used, or is using, at least one on these outstanding free network monitoring tools. If you think that I didn’t cover all available tools that are rated by thousands of system administrators all over the world and other simple users, then comment down please your tool and tell us why you prefer to use it not what I listed above.

The post Network Monitoring Tools You Have To Know appeared first on Unixmen.

Viewing all 33 articles
Browse latest View live